Past IEM Features tagged: temp
What was the low in Ames yesterday?
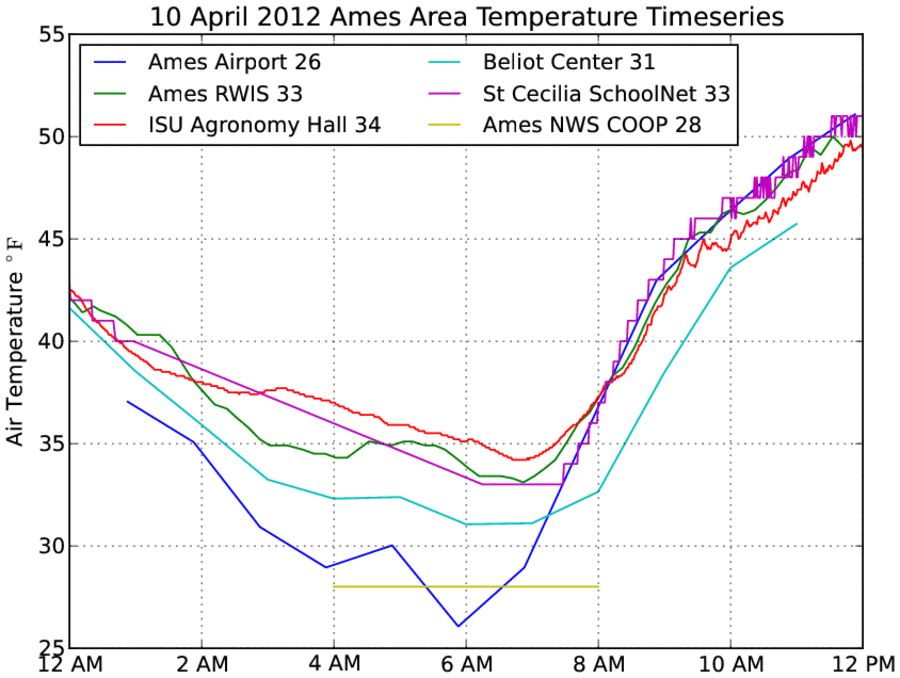
11 Apr 2012 05:55 AMWith temperatures near freezing, many anxious folks were wondering what the low temperature was on Tuesday for Ames. The answer is: "depends on who you ask!" The featured chart presents observation time-series for various weather stations near or within Ames. The Airport sensor is the official temperature for Ames and was much colder than any of the other sites. The hourly observations are presented on the chart and the site actually reported a low of 23 in-between the hourly reports. Other sites hovered just above freezing. This chart will be updated later today once the minute interval data from the airport sensor becomes available. Also, the NWS COOP site reports once daily and is represented by the short line. Temperatures are colder this morning, so we will have to see how much damage these two days cause the vegetation
Update: Sorry, the one minute interval data from the airport came in mostly missing for this time period.
Voting:
Good: 21
Bad: 5
Tags: ames temp
Shortest daylight isn't coldest
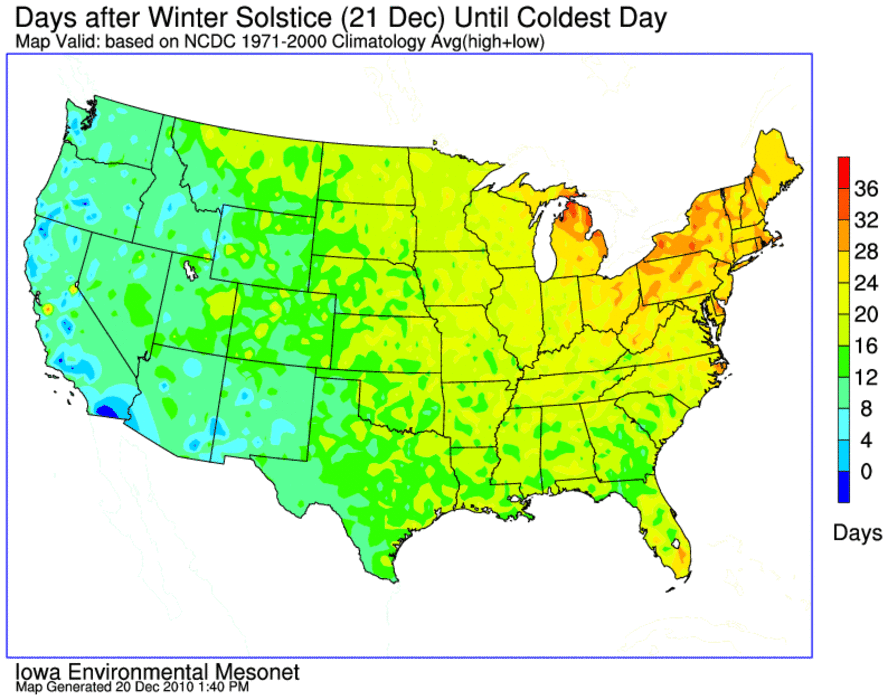
21 Dec 2010 05:46 AMToday is the winter solstice, when the daylight hours are the shortest for the year. Intuitively, one may expect this to be the coldest day of the year since it would have the least amount of sunshine. The featured map presents an analysis of the number of days after the solstice when the coldest day locally occurs. For Iowa, this works out being the middle of January. The east to west pattern over the United States is interesting as it takes a bit longer to cool the regions around the Great Lakes.
Voting:
Good: 24
Bad: 3
Tags: winter temp
Fall Duration
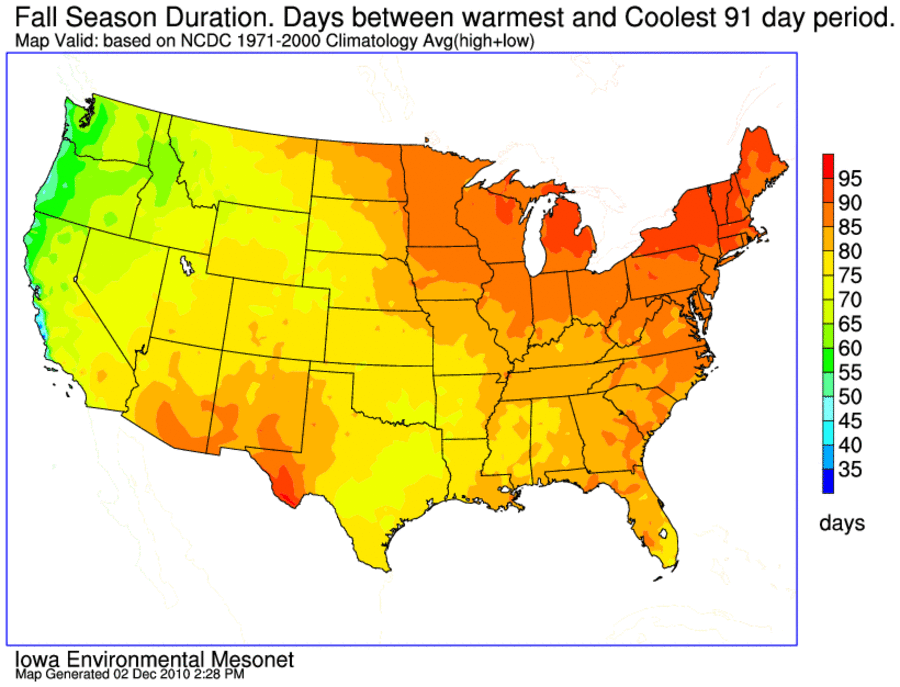
03 Dec 2010 05:46 AMFollowing up on the previous day's feature, today's featured plot presents an IEM computed metric of the climatological duration of the fall season. The number of days presented represent the time between the warmest 91 day period and coolest 91 day period based on daily climatological high and low temperatures. Think of it as the number of days it takes to get from the warmest quarter of the year to coolest. Iowa is shown right around 90 days, which is about what one would expect for having evenly distributed seasons. The plot would suggest that if you like the fall, don't live on the west coast!
Voting:
Good: 47
Bad: 12
Tags: fall temp

When does winter start?
02 Dec 2010 05:48 AMWhile yesterday was the start of meteorological winter, the 21st is the start of the commonly defined winter season. If one considers winter a 91 day period with the coldest climatological temperatures, the actual start of winter is slightly before 1 December in Iowa. The feature map presents an IEM produced analysis of the start date of the coldest 91 consecutive day period based on climatology data. The map nicely shows the start of this period comes first for those in the western US and marches east with a ~4 week difference between the two. The coastal regions of California enjoy the moderating effects of the Pacific Ocean and appear to be the last to join the winter period.
Voting:
Good: 31
Bad: 4
Tags: winter temp

Changes in time
19 Oct 2010 05:52 AMA final feature on the diurnal temperature cycle. This plot presents a crude analysis of when the low and high temperature occurs each day based on minute interval data. Some adjustment was done to the plot to remove cases of having the low or high temperature set at midnight. The plot nicely shows the annual cycle of when the low temperature occurs, which is typically just before sunrise. The high temperature is more constant and typically occurs around 4 PM CDT (or 3 PM during the winter time). Many people think the highest temperature occurs at noon when the sun is the most direct (highest in the sky), but since the net downward radiation is still positive well into the afternoon, we continue to warm.
Voting:
Good: 22
Bad: 3
Tags: climate temp
Monthly patterns
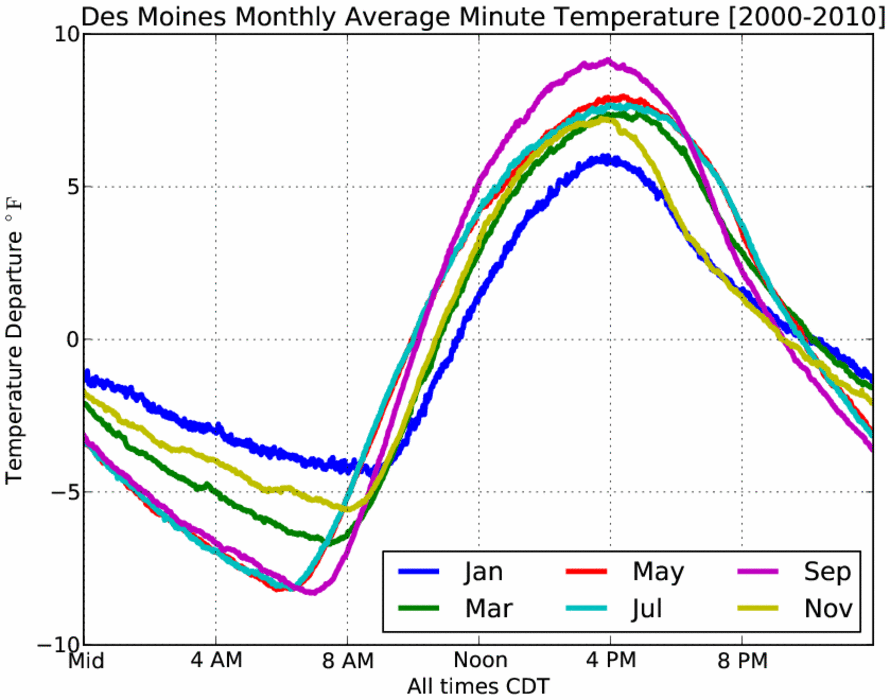
18 Oct 2010 05:47 AMContinuing along looking at the diurnal cycle of temperatures, the featured graph presents the monthly average for six months out of the year. The weakest signal is shown in January and the strongest in September. It is interesting to contrast the patterns as September has the most rapid warming, but also the most rapid cooling. This is a result of still having significant sunshine, but also dry air allowing the rapid changes. It is curious to note how similiar July and May are. This analysis is based on minute interval data dating back to only 2000.
Voting:
Good: 22
Bad: 1
Tags: climate temp

Daily Temperature Cycle
16 Oct 2010 06:25 AMThe featured chart presents the average daily diurnal temperature cycle. The values are the departure from the daily mean temperature. The chart nicely depicts the profile of when the warmest and coolest temperatures are each day. The magnitude of the values during the winter season are less due to the decreased power of the sun and dominance of warm and cold air advection not forced by the sun. This time of year and April see the strongest diurnal signal thanks to decreased amounts of water vapor in the air (warms and cools more quickly).
Voting:
Good: 36
Bad: 9
Tags: climate temp
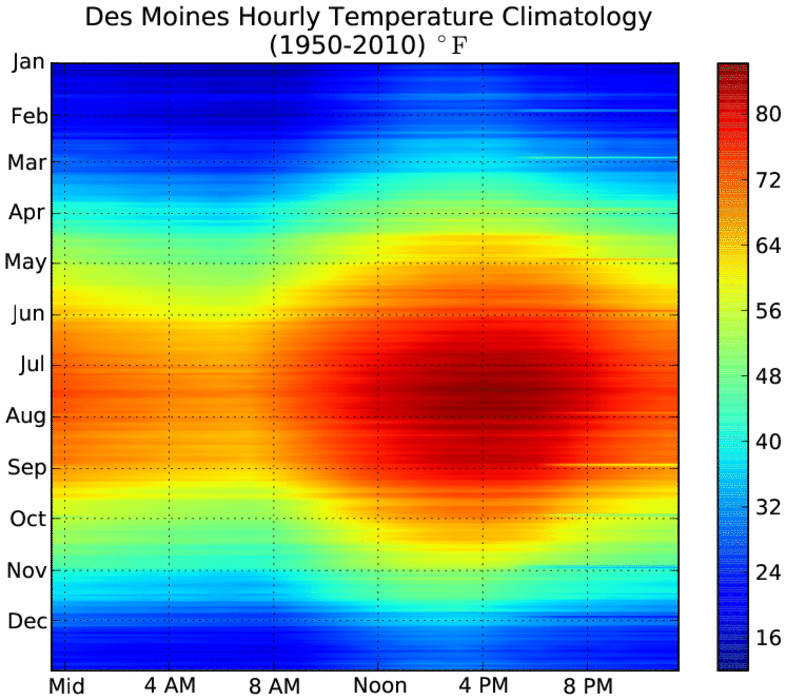
Hourly Temps
15 Oct 2010 05:55 AMThe colorful feature image presents the hourly temperature climatology by hour and day of the year for Des Moines based on 60 years of data. The plot shows our warmest time of the year during the mid afternoon in July and our coldest time of the year during the early morning hours in January. For mid October, you can see our warm afternoon temperatures are fleeting with cooler weather increasing with each passing day. Our actual weather looks to continue the pleasant weather streak with highs in the 60s and low 70s.
Voting:
Good: 35
Bad: 9
Tags: climate temp