July Departures
Posted:
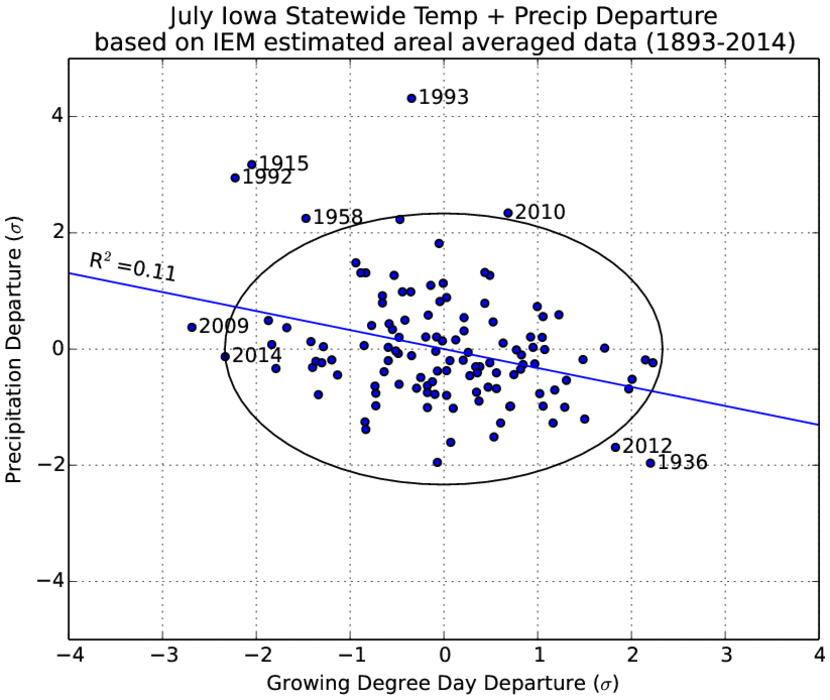
The featured chart looks at the combination of growing degree day (base 50) and
precipitation departures for the month of July over the state of Iowa. This year's July was
one of the coolest on record and on this chart shows up about normal for precipitation.
The departure metric used is in units of sigma or one standard deviation based on the
distribution of historical GDD and precip totals for July. The circle on the chart represents
the distance from the origin the 2014 value was with more extreme years labelled on the
chart. It is interesting to see four of the past six years labelled on this chart meaning that
most of our recent Julys have been extreme!
Voting:
Good = 13
Bad = 8
Abstain = 9
Tags: jul
Voting:
Good = 13
Bad = 8
Abstain = 9
Tags: jul