Past IEM Features tagged: jul

July Highs vs Lows
29 Jul 2020 05:05 AMThe featured chart presents a comparison between yearly average high and low temperatures during July for Ames. The plot is divided up into four quadrants based on the average value for all the lows and highs. There is a decent relationship between the two, which makes sense as warmer high temperatures are generally associated with warmer low temperatures. Our actual values this year are close to average. The chart is a good reminder that while summer days in Iowa can be hot, the average low temperature values aren't too bad and at temperatures that allow buildings and such to cool off during the night time hours.
Voting:
Good: 9
Bad: 0
Tags: jul

Tight July Range so Far
09 Jul 2020 03:54 AMThe featured chart presents the warmest high, coldest low, and the range between the two during July for Ames. The range so far this July has been very tight with the coolest low temperature only in the mid 60s. Each plot shows a simple long term average and trailing 30 year average. The trends follow other summer time metrics in the state with increasing summer low temperatures and decreasing high temperatures. The forecast this July continues the hot temperatures with perhaps some warmer highs than yesterday coming next week.
Voting:
Good: 14
Bad: 0
Tags: jul
July maxes
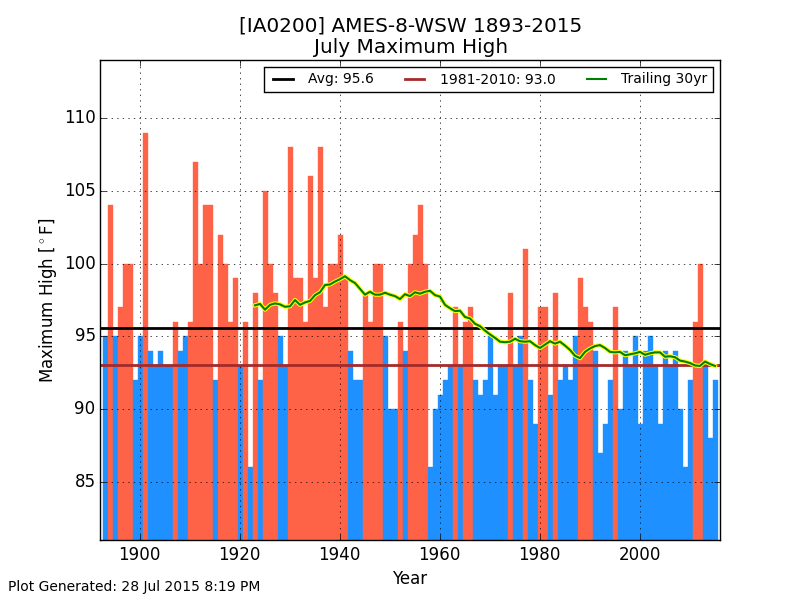
29 Jul 2015 05:44 AMWith only a few days of July remaining and those forecasted to have highs in the 80s, it looks like this July will continue the recent trend of cooler maximum temperatures as shown by the featured chart. The maximum July temperature for Ames is shown along with 3 average metrics. A long term average, an average only considering the 1981-2010 period, and a trailing 30 year moving average. The bar coloring represents if that July was below the long average. This chart illustrates one of the strong climate change signals in the state, which is for lower peak maximum temperatures during the summer.
Voting:
Good: 18
Bad: 5
Abstain: 7
Tags: jul
July Highs and Lows
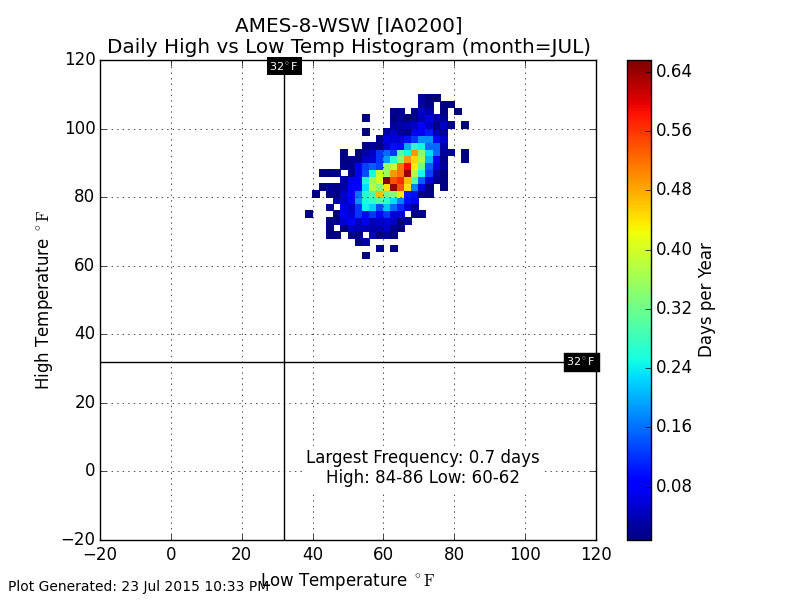
24 Jul 2015 05:43 AMThe last few days have seen lows in the 50s and highs in the low 80s, which is on the cool end on what we would expect for July. The featured chart displays a 2D histogram of the combination of daily highs and lows for Ames during July. The highest frequency bin is a few degrees warmer than our recent weather. The forecast for Friday and this weekend has a return of the hot and sticky weather.
Voting:
Good: 16
Bad: 13
Abstain: 13
Tags: jul
July Ranges
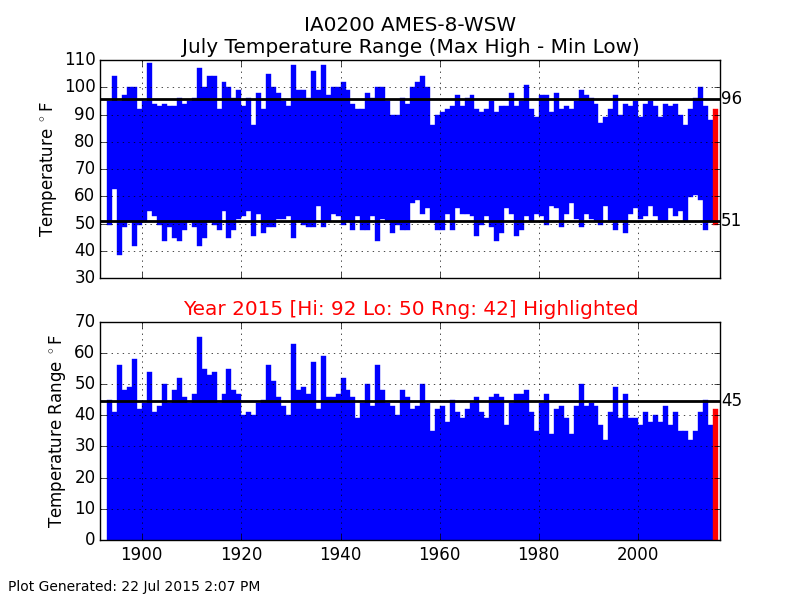
23 Jul 2015 05:43 AMThe featured chart presents the warmest high and coldest low each July for Ames with the bottom chart representing the range between those two values. The bottom panel is very interesting as it shows a long term trend of decreasing temperature range with this year falling in line with recent years below the long term average. One theory for this trend is that humidity levels have increased during July, which help to moderate swings in temperatures (difficult to get very hot during the day and very cold at night).
Voting:
Good: 13
Bad: 10
Abstain: 6
Tags: jul

July Days below 60
15 Aug 2014 05:45 AMOur cool summer has continued in August with not much heat to speak of during the day and very sleepable overnight low temperatures. The featured chart presents the number of days with a low temperature below 60 for Des Moines for July. This July had the second most on record and firmly above any recent year. The forecast has slightly warmer overnight temperatures with the return of some humidity, but highs will continue to struggle.
Voting:
Good: 27
Bad: 17
Abstain: 17
Tags: jul

Warmest July Temps
05 Aug 2014 05:42 AMFor some locations in the state, like Ames, this recent July failed to reach 90 degrees. The featured chart displays the yearly maximum temperature reported during July. While the long term average is near 96 degrees, most of the recent years have struggled to reach that level. The 1930s show up prominently on this chart with a stretch of around 15 years all above current long term average. The near term forecast does not hold much hope for significant heat.
Voting:
Good: 15
Bad: 4
Abstain: 7
Tags: jul
July Departures
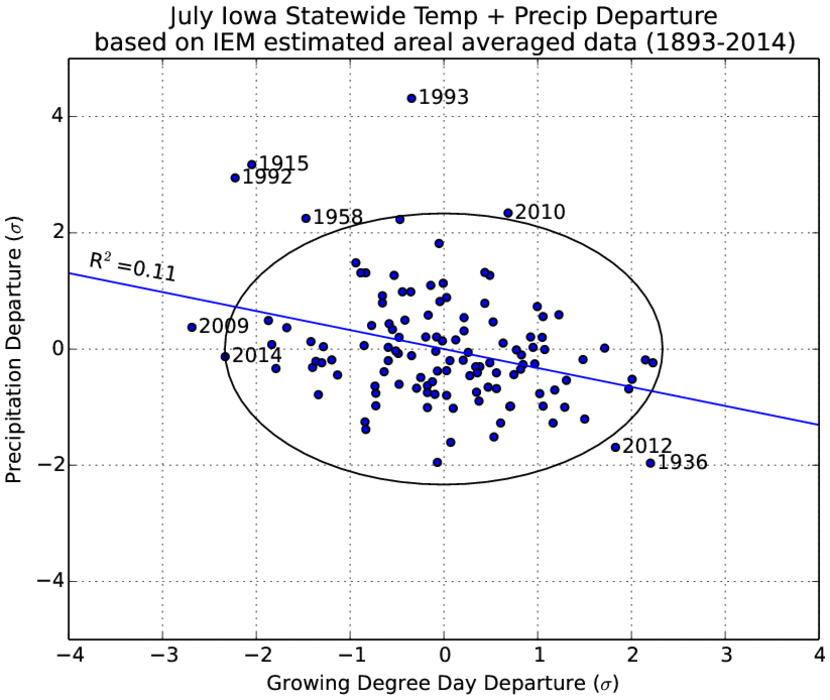
04 Aug 2014 05:32 AMThe featured chart looks at the combination of growing degree day (base 50) and precipitation departures for the month of July over the state of Iowa. This year's July was one of the coolest on record and on this chart shows up about normal for precipitation. The departure metric used is in units of sigma or one standard deviation based on the distribution of historical GDD and precip totals for July. The circle on the chart represents the distance from the origin the 2014 value was with more extreme years labelled on the chart. It is interesting to see four of the past six years labelled on this chart meaning that most of our recent Julys have been extreme!
Voting:
Good: 13
Bad: 8
Abstain: 9
Tags: jul
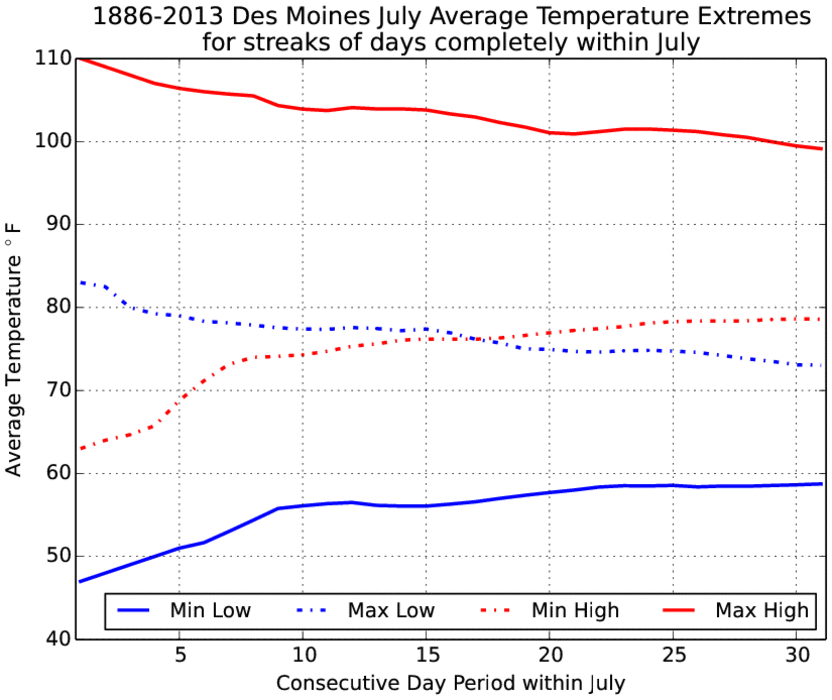
Warm and Cool July stretches
18 Jul 2014 06:36 AMThe featured chart represents the warmest and coolest stretch of days in July for high and low temperature for Des Moines. Only consecutive days completely within July are considered. For example, for a ten day period the maximum average high temperature was around 105 and minimum near 75. This week's cool weather has not exceeded any of these values.
Voting:
Good: 19
Bad: 11
Abstain: 14
Tags: jul

Coldest July Temps
15 Jul 2014 05:39 AMLow temperatures this morning are in the lower 50s and some spots may bottom out in the upper 40s this morning! Needless to say, this is very chilly for July. The featured map displays the coldest July temperatures reported by the long term client sites in the state. We still have 5-15 degrees to go from this morning's levels before reaching all time lows. We will take another run at these temperatures tomorrow morning before a slow moderation into this weekend occurs with typical July temperatures arriving for next week.
Voting:
Good: 18
Bad: 5
Abstain: 6
Tags: jul
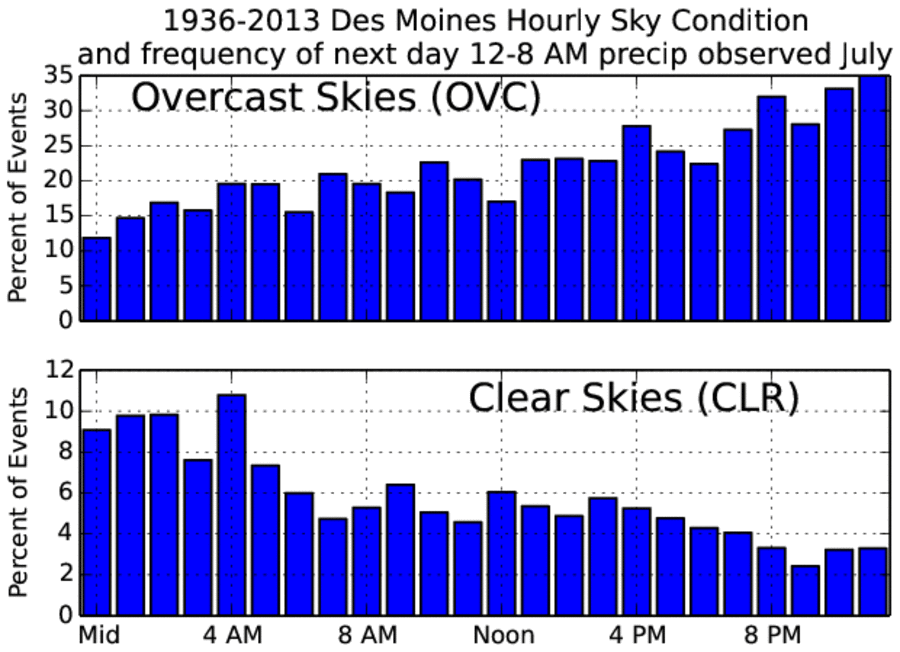
Clouds then Rain
09 Jul 2014 05:41 AMSkies were mostly fair on Tuesday with even the 4 AM observation reporting "clear" from the automated airport sensor in Des Moines. The featured chart looks at the frequency of having measurable precipitation for the midnight to 8 AM period the day following an hour with a given cloud coverage reported. In general, having overcast skies have more frequent rainfall events than clear skies which makes intuitive sense. Of course you have to have clouds for it to rain, so having overcast conditions later in the day leading up to the next day increases the frequency and having clear skies decreases the frequency. The overall frequency of having rainfall sometime during the 12-8 AM period in July is around 15%.
Voting:
Good: 8
Bad: 4
Abstain: 4
Tags: clouds jul

September warmer than July
09 Sep 2013 05:38 AMFor the month to date, the average temperature for 1-8 September has been warmer than 1-8 July for Des Moines. The featured chart shows the frequency of this happening for the first of each month to the given date. For the 8th, about one in five years have seen this happen. The forecast has parts of Iowa near 100 degree today with cooler weather expected by the end of the week. If Des Moines were to hit 100 degrees today, it would be the latest into the year for such a warm temperature.
Voting:
Good: 62
Bad: 11
Tags: sep jul
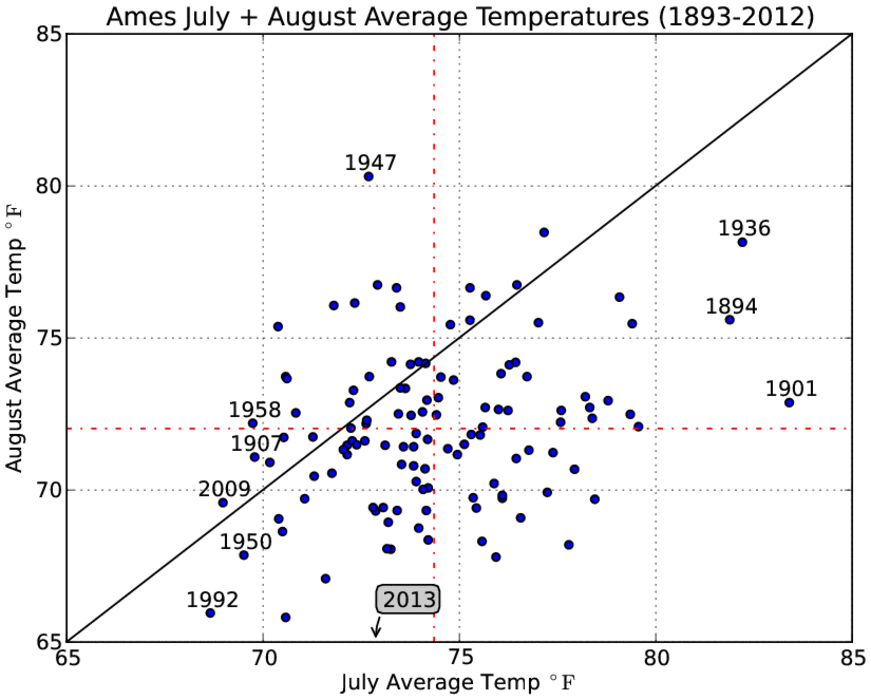
August vs July
05 Aug 2013 05:40 AMFor Ames, July ended up on the cool side of average for temperature. The featured chart presents the combination of August vs July average temperature for each year since 1893. A number of extreme years are labelled. While some recent feature plots have shown this year trending like 1947, the near term forecast does not indicate this August will be as warm as that. We could certainly use rain more than anything right now.
Voting:
Good: 70
Bad: 11
Tags: jul aug
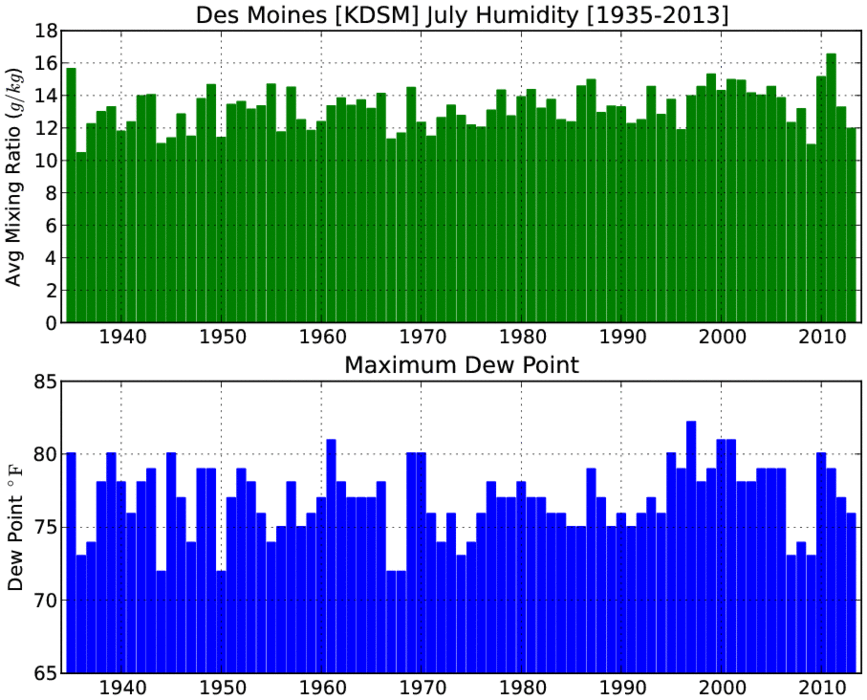
July Humidity
01 Aug 2013 04:35 AMThe featured plot presents a summary of two humidity metrics for the month of July for Des Moines. The top panel shows the average mixing ratio of water vapor to air and the bottom panel shows the highest dew point report for the month for each year since 1935. This year was on the dry side of both metrics and the driest since 2009, which was a cool July as well. Muggy air did return to the state to end July and looks to stick around for the start of August, air temperatures will not be that bad though in the lower 80s.
Voting:
Good: 87
Bad: 8
Tags: jul
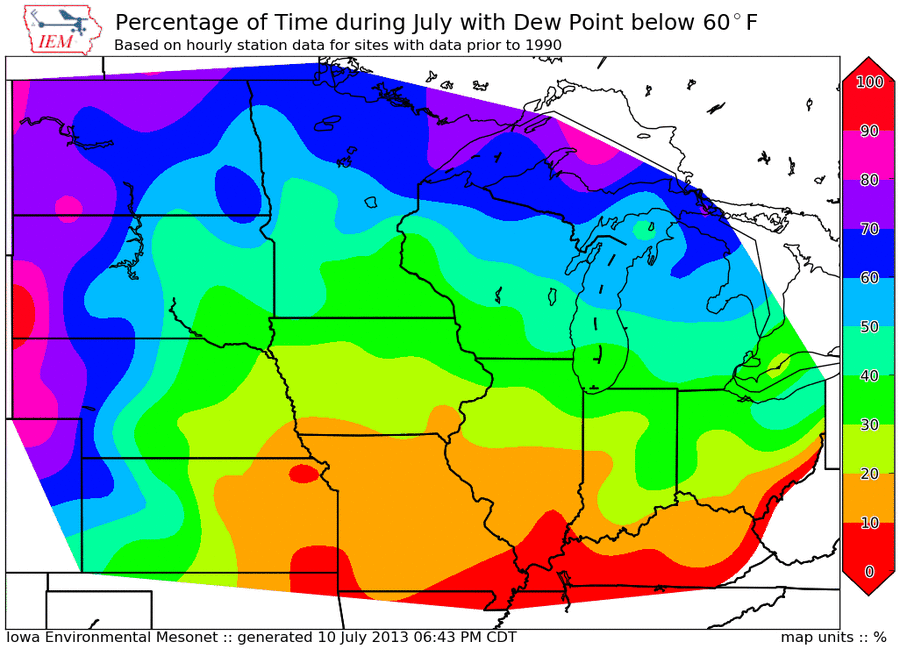
Sub-60 Dew Points in July
11 Jul 2013 05:12 AMVery comfortable air arrived in Iowa on Wednesday with dew point temperatures only in the 50s. The featured map looks at how common it is to have sub 60 degree dew point temperatures in July. Iowa is analyzed in the 20-40 percent of the time range with frequencies decreasing the further south you go. The benefit of having such a low dew point temperature is that it allows the air to cool to that temperature overnight making for windows-open sleeping weather! Humidity is expected to slowly build back into the state with dew points back into the 60s to 70s next week.
Voting:
Good: 99
Bad: 13
Tags: jul
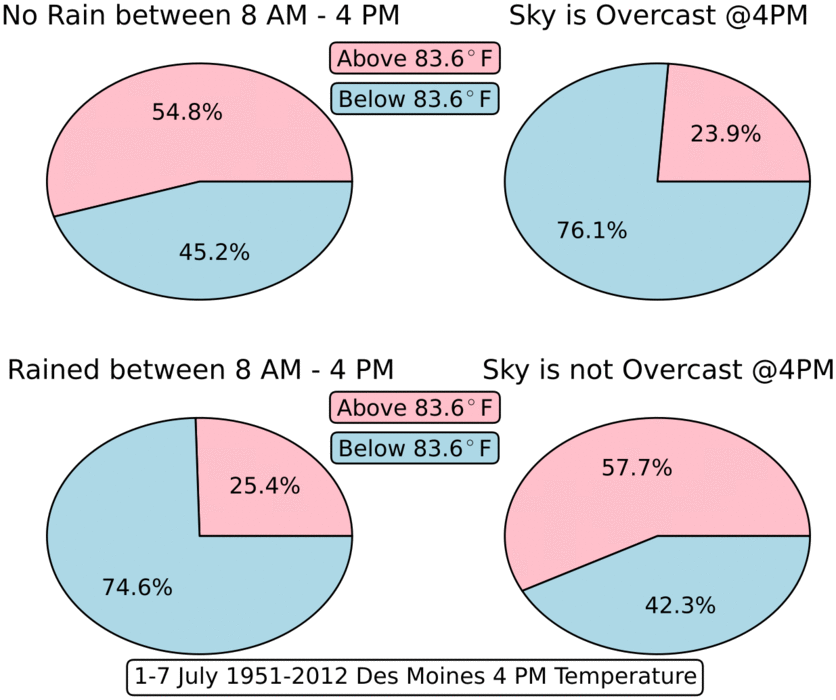
4 PM, First week of July
02 Jul 2013 05:27 AMTemperatures were just about average across the state on Monday with the 4 PM temperature at Des Moines of 84 degrees coming in at the long term average for the first week of July at 4 PM. The featured set of pie charts present the percentage of days that the 4 PM temperature was either above or below average when a given condition occurred. For example, when there was no rainfall between 8 AM and 4 PM the temperature was above average about 55% of the time. However, when it did rain, about 75% of the days had a below average temperature at 4 PM. Having an overcast sky at 4 PM also shows a strong signal with 76% of the days also being below average at 4 PM for temperature.
Voting:
Good: 82
Bad: 10
Tags: jul
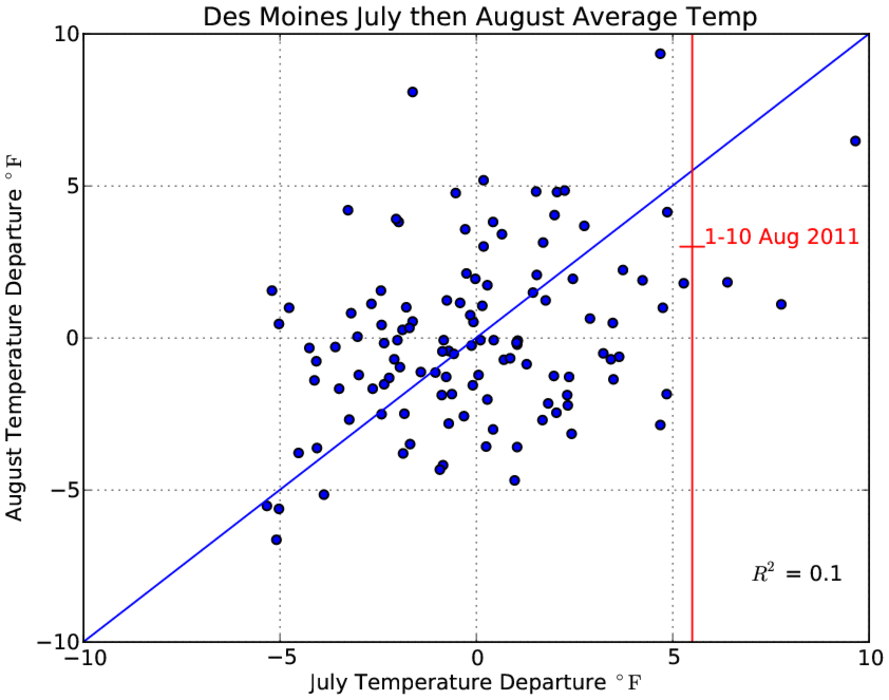
Warm August as well?
11 Aug 2011 08:20 PMThe past few days have been a welcome relief from much warmer weather in July and the first few days of August. The featured chart compares the July average temperature departure from average against the following August departure. The low correlation and visual appearance would indicate that one does not necessarily beget the other. The departure so far this August is about the same as July. The forecast has temperatures near average for the next week or so.
Voting:
Good: 18
Bad: 8
Tags: jul aug

Still featuring July
10 Aug 2011 10:20 PMIt is hard not to keep featuring interesting stats from July after such an exceptional month! The featured chart displays the July high and low temperature departures from long term average for Des Moines. The bottom plot displays the monthly high versus low departure with a good correlation of 0.6 shown, which means warm highs usually mean warm lows and vice versa. The red dot on the scatter plot shows how exceptional this year was for low temperature.
Voting:
Good: 10
Bad: 6
Tags: jul jul11

Unequally warm July
09 Aug 2011 07:08 PMNOAA recently released estimates of July average temperatures and put this year as the 7th warmest on record for Iowa. The featured chart presents an analysis of hourly temperature departures and percentiles based on hourly data for Des Moines. The plot clearly shows the most exceptional temperatures occurring during the night time hours, which indeed tells the story of this month having very warm low temperatures. This was a result of the record amount of humidity in the state this July helping to keep temperatures warm overnight. Based on some IEM calculations: this July was the warmest on record for low temperatures statewide, but only the 40th warmest for highs (since 1893). The average of those two values gets us to 7th warmest.
Voting:
Good: 14
Bad: 5
Tags: jul jul11
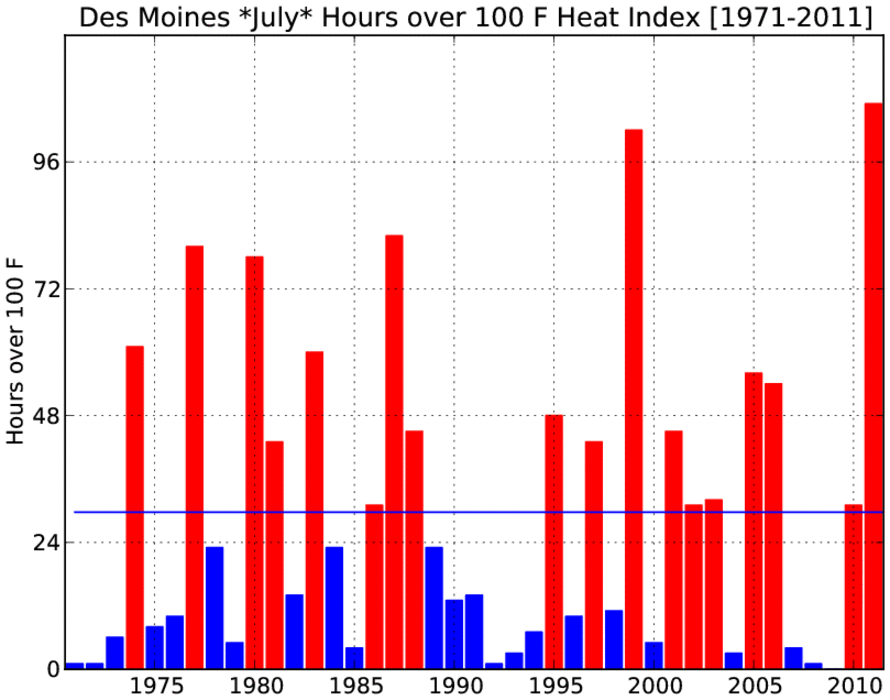
Steamy July
01 Aug 2011 05:45 AMThankfully, July of 2011 is history, but the heat and muggy weather looks to continue. The featured chart presents the number of hours during July for the past 40 years that the heat index was above 100 degrees for Des Moines. This year's total comes in slightly higher than 1999. The average during this period is just over 28 hours as shown by the blue line.
Voting:
Good: 19
Bad: 2
Tags: jul11 jul
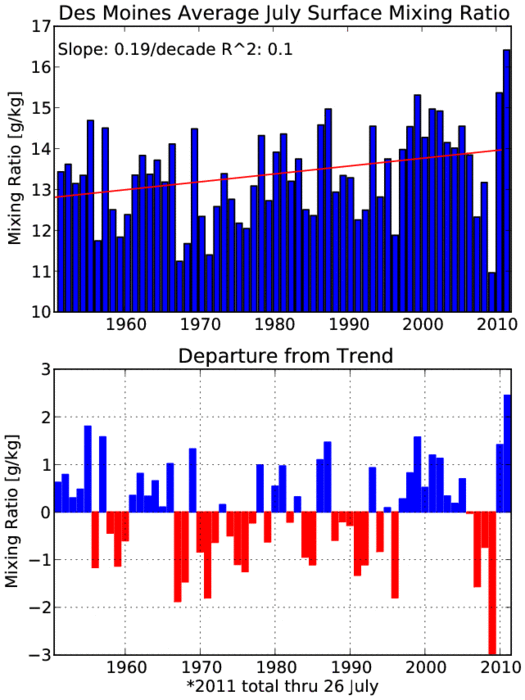
More Humid than the rest
27 Jul 2011 05:58 AMThis month has seen a remarkable amount of humidity in the area as shown by the featured chart comparing average mixing ratio for July since 1951 at the Des Moines Airport. Last year had been the previously most humid for July, but this year has soundly beat it by a full gram! Of course, there is still a few days left in this July, but judging by the forecast, the sticky weather looks to stick around until the end of the month.
Voting:
Good: 39
Bad: 6
Tags: jul jul11

Warm July Nights
26 Jul 2011 05:52 AMThis July has been one of the warmest we have seen in a very long time. As measured by average daily low temperature, this year comes in second behind 1936 based on IEM statewide estimated data as shown by the featured chart. Years above average are shown in red and the 1930s really stand out. One reason why overnight lows have been so warm is the vast amount of moisture in the air this month (more on this tomorrow). The warm weather is expected to continue until the end of the month.
Voting:
Good: 56
Bad: 3
Tags: jul11 jul
Warmest days of the year
17 Jul 2008 06:31 AMThe middle of July is the warmest time of year and has been no exception this year. A boundary will try to sink south today and bring some relief for Friday with highs in the mid 80s.
Voting:
Good: 15
Bad: 3
Tags: jul

Southwest winds are the hot ones
06 Jul 2007 07:15 AMThe featured chart is an attempt to determine the relationship between observed July air temperatures and wind directions at 4 PM from the Des Moines Airport. The contour plot is a density field with the red area representing the 90th percentile (most common). Focusing on that area, we see a clear trend for increasing temperatures as winds switch from the SE to SW. The side histograms show the distribution of the observations with the dark green showing the distribution of winds while the temperature is above 90 degrees. Again, the SSW and SW winds are the most frequent when temperatures are the warmest. So what is the moral of the story? Having winds from the SW are an important factor to drive temperatures into the mid and upper 90s.
Voting:
Good: 32
Bad: 11
Tags: jul