Automated Data Plotter
This application dynamically generates many types of graphs. These graphs are derived from processing of various data sources done by the IEM. Please feel free to use these generated graphics in whatever way you wish. Reset App. The IEM Explorer application offers a simplified frontend to some of these autoplots.
Second, select specific chart options::
Plot Description:
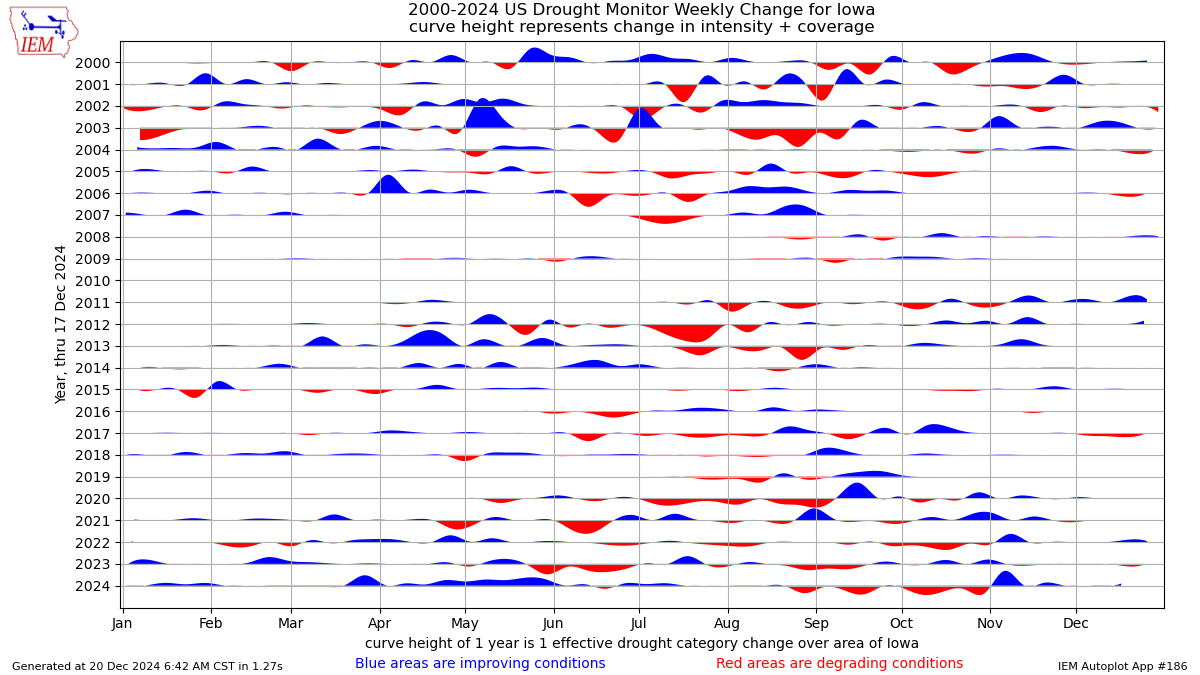
This plot shows the weekly change in drought monitor intensity expressed in terms of category change over the area of the selected state. For example, an arrow of length one pointing up would indicate a one category improvement in drought over the area of the state. This plot uses a JSON data service provided by the Drought Monitor website.In the case of plotting contiguous US values, the magnitude of the change values is multiplied by five as drought changes at that scale are slower than at the state scale when normalized by area.
Based on a sampling of recent timings for this application, plot generation time has averaged 3 seconds. Hold on for the plot is generating now!
 View Data (as csv)
Download as Excel
View Data (as csv)
Download as Excel
IEM Daily Features using this plot
The IEM Daily Features found on this website often utilize plots found on this application. Here is a listing of features referencing this plot type.
- 01 Feb 2024: Drought Monitor Updates
- 07 Apr 2023: Continued Drought Improvements
- 11 Aug 2022: Changes of the Drought Monitor
- 28 Oct 2021: Drought Improvements
- 31 Jul 2020: 2020 Drought Troubles
- 16 Aug 2019: Iowa Drought Changes
- 16 Aug 2018: Drought Monitor Weekly Changes
- 16 Feb 2018: Drought Improvement or Degradation this Spring?
- 21 Sep 2017: Drought Monitor Changes
- 09 Nov 2012: Weekly Drought Monitor