Past IEM Features tagged: watch

NWS Warnings Within Watch
10 May 2023 05:30 AMAs a part of the National Weather Service's mission of protecting life and property, they issue watches and warnings for storms capable of producing damaging winds, hail, and/or tornadoes. The watch is typically issued ahead of time when conditions are favorable for severe storms to develop and a warning is issued when severe conditions are imminent. Of course, not all NWS warnings occur within an area that is currently under a watch. The featured chart looks into this frequency by computing the percentage of severe thunderstorm or tornado warnings that were issued when a watch was in effect for the warned county. The data is partitioned by month as there is a clear annual signal to this metric and is easily explained. Watches are issued for organized severe weather events that have considerable spatial and temporal scale. Summer time severe weather is very often isolated, slower moving, and limited to the late afternoon during peak heating, all of which don't lend well to the watch process.
Voting:
Good: 11
Bad: 0
Tags: watch warning
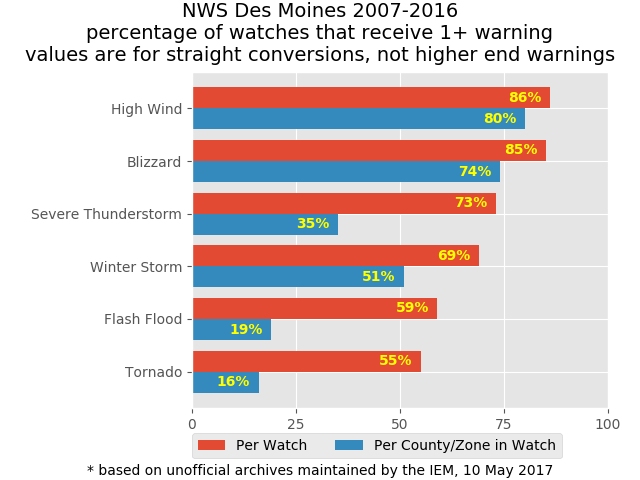
Watches
11 May 2017 12:02 AMNWS Des Moines issued two watches yesterday, a Severe Thunderstorm Watch and a Flash Flood Watch. The eventual storms yesterday did yield a few Severe Thunderstorm Warnings over the watch area and even a few tornadoes further east within Davenport NWS's area, but no Flash Flood Warnings. The featured chart looks at some IEM computed metrics on the conversion of watches into warnings. The red bars represent the overall frequency of converting an individual watch event into a warning (meaning getting at least one warning anywhere within the watch). The blue bars represent the individual county/zone conversion of a watch into a warning. For example, there is a 59% chance of getting at least one warning within the Flash Flood Watch yesterday and 19% frequency of an individual county within the watch getting one warning. The moral of this story is that not all watches are created equal. The actual size of the event the watch is for creates large differences in the frequencies. One item to note is that this plot is for a straight conversion and does not consider the situation of the eventual warning being of a different type. For example, some Winter Storm Watches become Blizzard Warnings.
Voting:
Good: 5
Bad: 0
Tags: nws watch
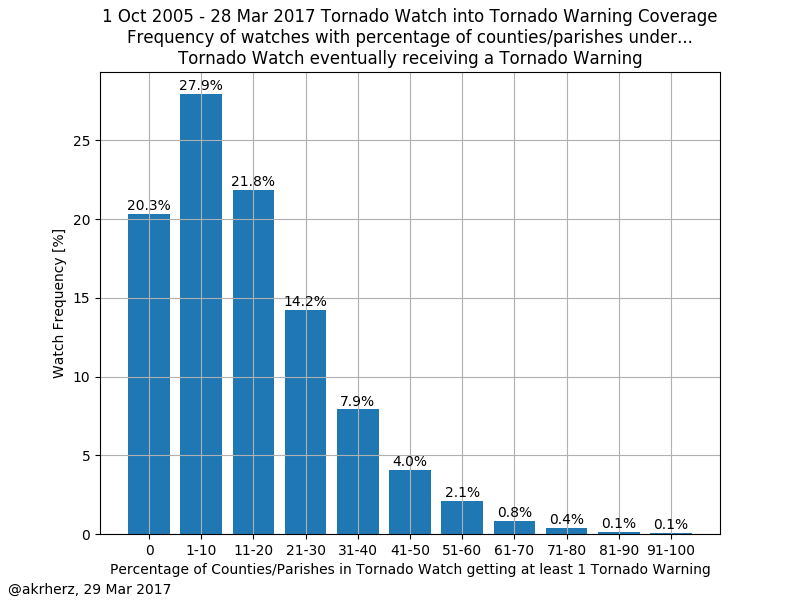
Tornado Watches into Warnings
30 Mar 2017 05:33 AMContinuing with the theme of Severe Weather Awareness Week in Iowa this week, yesterday was the statewide tornado drill with a test watch and warning issued for the entire state. Today's featured chart looks at the conversion of counties under a tornado watch into a tornado warning. For example, if a tornado watch was issued for 60 counties and 30 of those counties received a tornado warning, that would count with the 50% bin for the plot. About 20% of all tornado watches receive no subsequent warning. Most watches have less than 30% of the counties included eventually get a warning. Thankfully, tornadoes typically are not widespread and limited to a couple of high end storms during a typical watch. Hopefully that is the case today with a significant tornado threat expected over the southern US.
Voting:
Good: 7
Bad: 0
Abstain: 1
Tags: nws spc tornado watch

Fewest Watches
08 Nov 2016 05:35 AMThe featured chart displays the number of year to date Severe Thunderstorm and Tornado Watches issued by the Storm Prediction Center since 1997. The top panel displays the number issued nationwide, the middle panel shows the number that had any part of the initial watch outline overlap Iowa, and the bottom panel shows the percentage of watches that overlapped Iowa for that year. This year's total is a mere 52, which is the lowest found within the modern database. It is interesting to see each of the past five years show up in the least number of watches for the period.
Voting:
Good: 4
Bad: 1
Tags: spc watch

Watch into Warning
06 Jun 2014 05:42 AMThe Storm Prediction Center issued a tornado watch for portions of northwestern Iowa on Thursday evening. Thankfully the tornado threat did not materialize and no warnings were issued for Iowa after the watch came out. How common is it to have a tornado watch and then not a warning for a given county in the state. The featured map attempts to answer just that question with the percentage of events whereby a county under a tornado watch gets a tornado warning issued. While the percentages may appear low, they do roughly match the spatial confidence of a watch issuance. The overall map average is near 15%. Winneshiek County has the lowest percentage (0%: only 3 tornado warnings since 2005 and all not within a tornado watch) and Pocahontas County has the highest percentage (29%).
Voting:
Good: 47
Bad: 22
Abstain: 15
Tags: tornado nws watch warnings
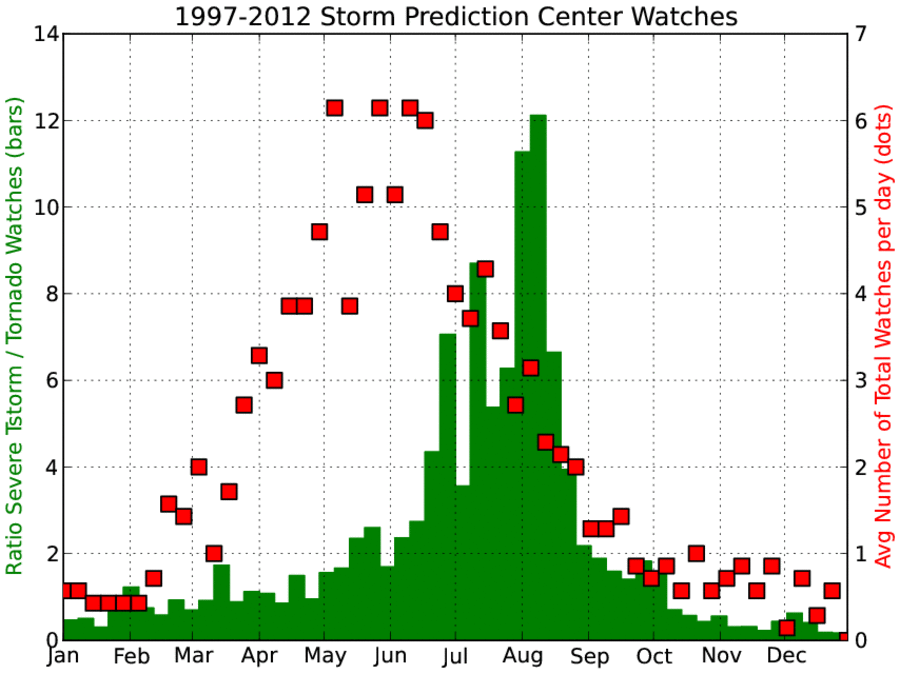
Watch Frequencies
20 Jul 2013 07:50 PMA number of severe thunderstorm watches have been issued today by the Storm Prediction Center (SPC). None of these in Iowa though. Anyway, the featured chart presents the daily frequencies of SPC issued watches and the ratio between the number of severe thunderstorm versus tornado watches issued. Both have clear annual signals with their respective peaks happening at different times of the year. The largest number of watches (dots) occur during the strongest battles of the air masses during the spring season. The bars shows the ratio of severe thunderstorm versus tornado warnings. This ratio peaks out during the first two weeks of August as temperatures are the warmest over the United States and the cool air masses are well north leading to less wind shear in the atmosphere.
Voting:
Good: 74
Bad: 7
Tags: spc watch