Past IEM Features tagged: vpd

Fighting Dry Air
15 Dec 2023 05:30 AMA somewhat required step one for getting any significant amounts of precipitation is to have air that is humid enough to allow condensed water aloft to reach the ground without evaporating. We have had a number of events this fall season struggle to produce with ample dry air in place over Iowa. Such will be the case for much of today with an approaching storm system needing to overcome dry air, but rain is expected overnight Friday into Saturday although only meager totals will fall. An illustration of our recent issues with dry air can be found with the featured chart. It presents the daily climatology and 2023 values of vapor pressure deficit. This is a measure of the demand for water from the atmosphere. A higher value indicates a drier air and thus higher demand for water. A value of zero would indicate saturated air unable to hold any more water vapor. So the bottom panel shows the daily departures and you can see they are almost all red (increased atmospheric demand for water) since the first of November.
Voting:
Good: 12
Bad: 1
Tags: vpd
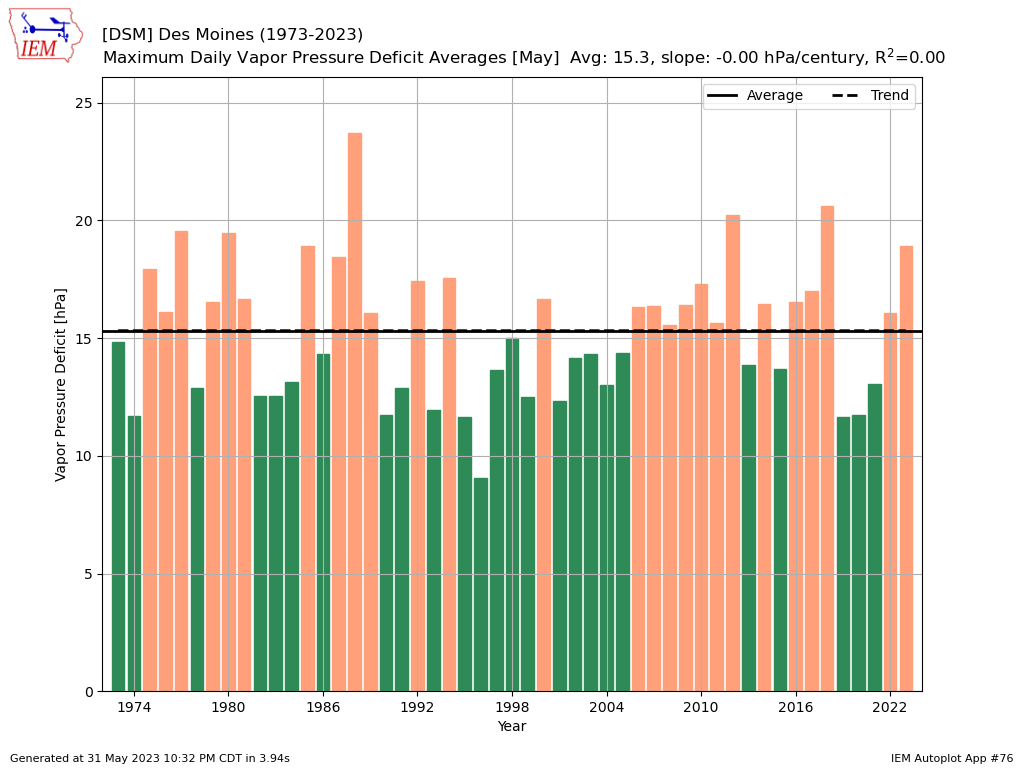
May Max VPD Averages
01 Jun 2023 05:30 AMVapor Pressure Deficit (VPD) is a weather variable that isn't as commonly used to express humidity like dew point and relative humidity are. The values also have units of pressure, which makes them even a bit more obtuse. So what use are they? They represent an absolute measure of potential demand from the air of water vapor from various surfaces that may contain water. For green house operators and horticulture folks, knowing VPD can inform plant health and development. The featured chart presents the average May daily max VPD values for Des Moines. Rewording, the maximum VPD is calculated each day of each May and then averaged by year. The 2023 value is higher than a simple average and higher than the past four years. Higher values indicate increased demand for water vapor or perhaps you could consider it as a suction force. It is interesting to see 1988 show up as the highest value since 1973, which of course, was a very bad drought year.
Voting:
Good: 8
Bad: 0
Abstain: 1
Tags: vpd
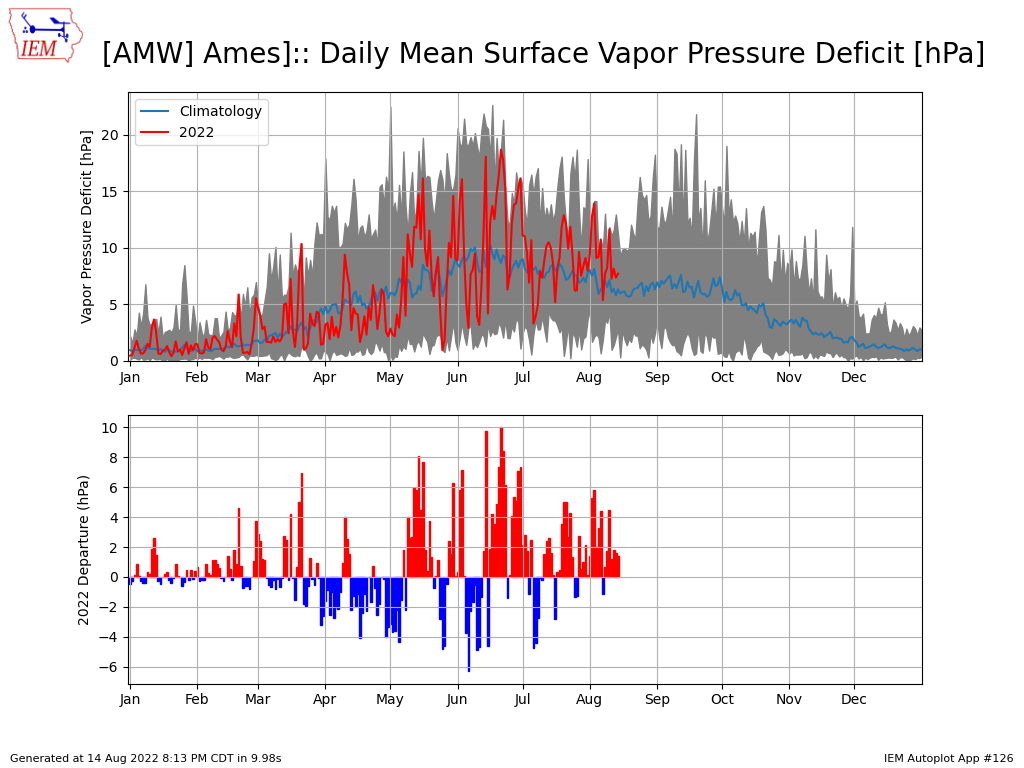
2022 Daily VPD
15 Aug 2022 05:30 AMThe featured chart presents daily climatology and 2022 values for vapor pressure deficit. The bottom panel shows the departure from a simple daily averaged climatology. This value is useful for diagnosing the magnitude of "suction" or "pull" the atmosphere exerts on plants for water. Drier and warmer temperatures will demand more water than cooler and more humid conditions. While a small positive of the ongoing drought conditions this summer is the lack of persistent muggy weather, the big downside is that vegetation struggles to retain water and smaller reservoirs of water are dried up. The daily departures this summer for Ames show many days since mid June with above average VPD values (implying an increased demand of water from the atmosphere).
Voting:
Good: 12
Bad: 0
Tags: vpd

Daily Vapor Pressure Deficit
22 Jun 2016 05:36 AMThe featured chart displays a metric called Vapor Pressure Deficit (VPD) computed from observations by the Ames Airport weather station. While relative humidity measures the normalized difference between the amount of water vapor in the air and what it could potentially hold at saturation, VPD expresses this difference in an absolute value of pressure. The application is that the higher the VPD value, the more suction power that the atmosphere will exert on surface reservoirs of water (plants, soils, etc). The top chart shows the daily range of values, the simple average, and values this year. The bottom chart shows the difference between this year and long term average. Differences in red are days with above average VPD, so above average atmospheric demand for water. For this June, you can see above average demand just about each day so far.
Voting:
Good: 10
Bad: 0
Abstain: 1
Tags: vpd vaporpressure