Past IEM Features tagged: stats
Mean, Median, and Mode
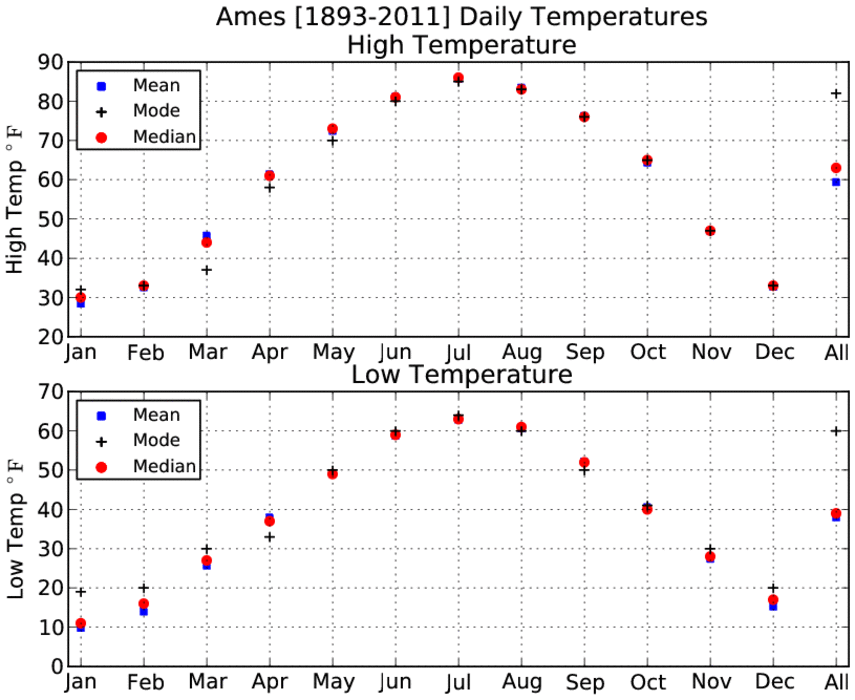
22 Aug 2011 06:03 AMToday is the first day of school for many, so the featured chart presents a refresher of something you should learned in middle school math. There are many ways to statistically represent a distribution of values. Three of those ways are the mean, the median, and the mode. The featured chart presents these three values for all daily temperatures on a monthly and annual basis. In general, these three values are close to each other except during the winter and springtime. The last value is for the entire year and there is a large difference between the mode and median/mean. Our summertime can be very persistent thanks to high humidities holding temperatures around 60 over night and in the low eighties during the day. This is about what our weather has been like for the past week and will be like for most of the coming week.
Voting:
Good: 15
Bad: 2
Tags: stats climate