Past IEM Features tagged: rwis

10 January Travel Troubles
11 Jan 2017 05:31 AMTravel was very difficult early Tuesday morning for many Iowans due to a layer of ice that formed on roadways. The setup for this icing event was rather tricky as shown by the featured chart. The chart depicts Jefferson RWIS road pavement and air temperatures, solar radiation observations from the Jefferson KCCI-TV SchoolNet and DOT/DPS Road Condition Reports. The yellow bar represents the time period that a road segment near this road sensor's location was reported to be partially covered with ice. The temperature time series show the interesting combination of having air and dew point temperatures above freezing with road temperatures below freezing. This combination along with falling rain left to the rain freezing on the road surface. The rain also likely helped to wash off much of the pre-treatment done on Monday. The cold front then trucked through after 10 AM dropping the air temperature below freezing as well, but the clouds broke up during the afternoon hours and pavement temps warmed back above freezing even with falling air temps. Many locations further north did not have pavement temps warm back above freezing and icy conditions remain a problem there.
Voting:
Good: 6
Bad: 2
Tags: rwis icing

Morning Frost
21 Jan 2015 05:39 AMHighway frost was a major issue over Iowa on Tuesday morning. The featured chart presents the combination of RWIS air, dew point, and pavement temperatures for US Highway 30 near Jefferson along with the reported road condition by the Iowa State Patrol. The clear issue shown in the chart is having the road temperature below the dew point, which causes deposition of water vapor onto a frozen surface. Once the road temperature raises above the dew point, the frost was gone and the road reported as dry.
Voting:
Good: 14
Bad: 4
Abstain: 3
Tags: frost rwis
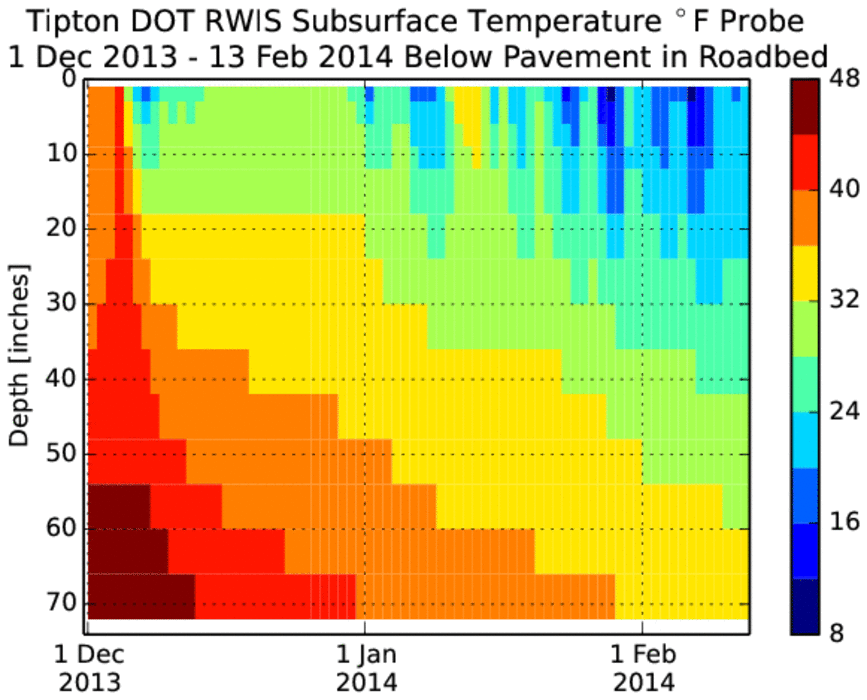
Deep Freeze
14 Feb 2014 05:40 AMA significant impact of the cold winter season has been an increase in underground water line breaks. These occur when freezing temperatures reach the depth that water pipes are buried. The featured chart displays a time series of average daily subsurface temperatures from the Tipton DOT RWIS site. This site has a probe taking a profile temperature down to 70 inches deep at a six inch interval. Sub-freezing temperatures are indicated down to five feet! The caveat with these readings is that the profile is below a pavement surface, which tends to have more sand / rock than soil. This permits more rapid cooling than underneath a grassy surface. The plot nicely depicts the temporal lag it takes for heat to be lost and temperatures cool, the further down the profile you go.
Voting:
Good: 45
Bad: 6
Abstain: 4
Tags: rwis frost

That escalated quickly
18 Jan 2014 05:49 AMThe featured chart is an attempt to explain why only a few inches of snow caused so much trouble for Des Moines on Thursday evening. The green line is the pavement temperature and blue line is the air temperature as observed by the Altoona RWIS site. The text abbreviations at the top are present weather reports from the Des Moines Airport sensor. (SN = snow, TSSN = thunder snow, BLSN = blowing snow, and the plus/minus indicate intensity with + being more intense than -) The colored blocks are the reported road conditions by the DOT for the location. The plot shows that prior to thundersnow report at 4 PM, temperatures were above freezing and the pavement temperatures were close to freezing for 30-45 minutes after the heavy snowfall started while air temperatures plummeted into the teens. So the situation was the initial intense snowfall melted, but soon after froze as air temperatures were way below freezing. The result was a layer of ice that formed on the roadways. The timing was terrible as well with this happening after 4 PM (the start of rush hour traffic). The plot does not show the intense wind speeds, which were creating ground blizzard conditions at the time.
Voting:
Good: 62
Bad: 15
Abstain: 11
Tags: rwis 2014
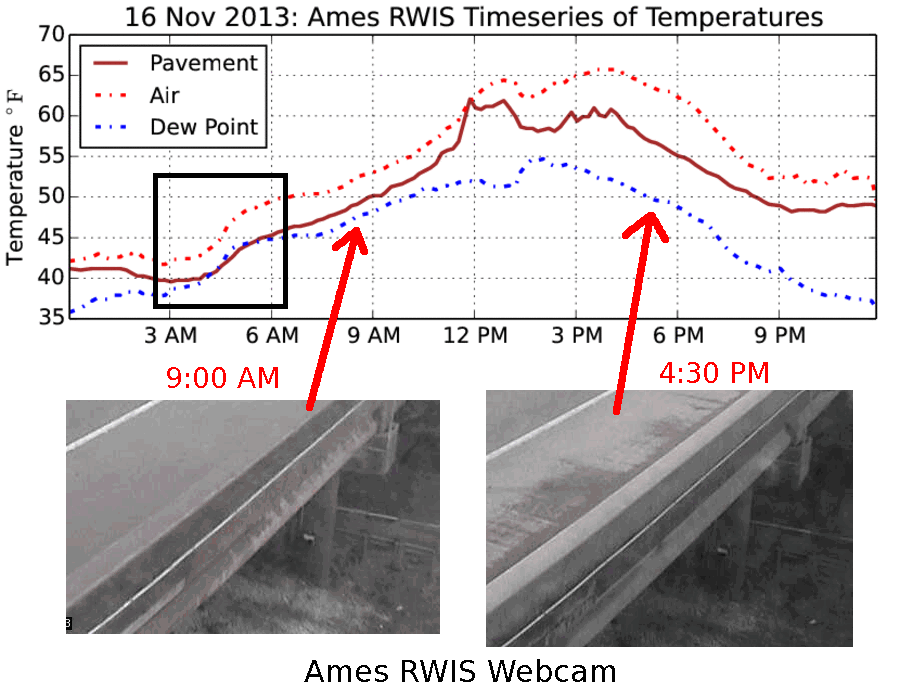
Wet Pavement
21 Nov 2013 05:41 AMFor those of you that were up by noon this past Saturday may have noticed that many concrete surfaces were wet that morning. The featured image displays two RWIS webcam images from that day along with a timeseries of air temperature, dew point, and bridge deck pavement temperature. The highlighted period during the morning shows the dew point being slightly warmer than the bridge temperature. When this happens, water vapor will condense onto the surface and that is why the concrete surfaces were wet that morning. When this process happens at temperatures below freezing, rhime and frost occur.
Voting:
Good: 50
Bad: 5
Abstain: 2
Tags: rwis

Better curves on sunny days
18 May 2011 05:57 AMThe featured chart is a timeseries from the Cantril RWIS site showing air, pavement, and sub surface temperatures since last Thursday. The impact of having sunny days on temperatures can clearly be seen with the textbook delayed response as you go deeper into the ground. The black dashed line is the temperature at 60 inches which was warming this past weekend while everything else was cooling off. While the impacts of sunshine near the surface have a daily signal, the deeper you go the slower things vary. You can even notice the difference between 8 and 16 inches.
Voting:
Good: 17
Bad: 9
Tags: rwis

Slowing down traffic
15 Dec 2010 05:51 AMThis past weekend's blizzard brought traffic to a near halt across the state as blowing snow reduced visibilities to near zero at times. The featured chart looks at the combination of NEXRAD radar reflectivity, near surface wind speed, and observed traffic speeds from the RWIS site near Adair along Interstate 80 west of Des Moines. The chart clearly shows the impact of precipitation on traffic speeds as the arrival of snow caused traffic to slow around noon on Saturday. The situation deteriorated throughout the afternoon as more snow fell and thanks to 40 mph winds that blew around enough, eventually leading to road closure later that evening. Winds died down by Sunday morning and road crews were able to get I-80 open once again.
Voting:
Good: 37
Bad: 3
Tags: rwis winter1011

Ice troubles
05 Jan 2009 06:05 AMIf did not take much rain on Saturday evening to turn Iowa's roads to a sheet of ice. The featured time series is from the RWIS site on US Highway 20 near Waterloo. The green line (dew point) tells the story of what happened to cause an icing event. Moist air was surging into the state on Saturday with air temperatures hovering just below freezing. Since the cold air was shallow and near saturation, rain was able to fall to the ground without much evaporation nor phase change and then immediately freeze as pavement temperatures were below freezing. The timing of this event late in the afternoon followed by a cold front passage both conspired to prevent most any melting over night. Cold temperatures on Sunday kept nearly all of this ice around on untreated surfaces.
Voting:
Good: 17
Bad: 10
Tags: ice rwis
Icy trip home from Grandma's
01 Dec 2008 06:20 AMThe featured chart is from the Marshalltown RWIS on Sunday into Monday morning showing air temperature and 3 pavement temperatures. The plot shows pavement temperatures warming nicely during the day with air and dew point temperatures creeping above freezing (implying a lot of liquid water on the road way). By later in the afternoon, colder air moved in and you can see the rapid drop off of temperatures and also notice the little bump in pavement temperatures near freezing when some heat is released by the water freezing around 4 PM. Roads remain slick this Monday morning.
Voting:
Good: 16
Bad: 8
Tags: ice rwis

Natural De-icer and re-icer
27 Feb 2008 07:23 AMThe featured graph is from the Ames RWIS site for the past 24 hours. While air temperatures (red) only reached 25 degrees, pavement temperatures reached 45 degrees at a rather rapid rate. The pavement then cooled off to the air temperature late in the evening with the loss of solar heating. Then around 2 AM, there is a change in the cooling rate. This is a result of the sky clearing allowing rapid cooling. You can generate plots like these here.
Voting:
Good: 20
Bad: 6
Tags: rwis
Got wet without rain
12 Nov 2007 07:12 AMA surge of very moist air made it into the state on Sunday with dew points (green line) rising into the mid 50s in Ames (RWIS site shown). If you get up before noon on Sunday, you should have noticed most surfaces being wet. The reason was that the dew point temperature was warmer than surfaces such as pavement, so air right next to the surface will cool to its dew point and water will be condensed out. The featured plot shows this as the 3 pavement temperatures become nearly equal during the morning hours before temperatures warm well above the dew point. You can also see the effects of the cold front that sweep out the moisture late Sunday night.
Voting:
Good: 17
Bad: 7
Tags: rwis

Warm pavement makes safe driving
02 Jan 2007 07:14 AMOur recent New Year's Eve snowstorm made driving home difficult Sunday night. The first day of 2007 brought bright sunshine and the pavement surface responded nicely as shown in the plot. While air temperatures were barely above freezing, pavement temperatures reached 45 degrees helping to melt all of the snow and ice off.
Voting:
Good: 16
Bad: 3
Tags: rwis
Sun has some power these days
22 Mar 2006 07:07 AMThe featured plot gives you an indication of how effective the sun is these days. The plot shows RWIS pavement temperatures and air temperature (red line) for Tuesday. After the snow storm ended mid morning, the clouds started to thin and more of the sun's energy reached the pavement surface and quickly warmed it up to around 60 degrees. The positive outcome is that road conditions quickly improve during winter weather this time of year.
Voting:
Good: 20
Bad: 8
Tags: rwis
Lots of interesting lines
03 Mar 2006 08:22 AMThe featured plot was taken from the RWIS time series plotter for the Ames site. You may want to click the image to get a better view. You can see how the pavement temperatures warm more than the air temperatures during the day. The implication is that the increasing solar angle is becoming more direct on the pavement surface and thus able to more efficiently warm it. So the next time winter precipitation falls, it won't take much sunshine to quickly melt the mess away.
Voting:
Good: 33
Bad: 19
Tags: rwis

Interesting pavement temperatures
28 Dec 2004 07:31 AMOne of the most interesting plots the IEM produces are the RWIS pavement temperature traces. The recent warm up of our air temperatures (red line) has produced a response from the pavement temperatures (blue, pink, grey lines) as they have warmed too, even in the middle of the night! The sub surface temperature (black line) has also responded and is slowly creaping back to just below freezing. Great stuff.
Voting:
Good: 10
Bad: 3
Tags: rwis
Slippery Roads
30 Nov 2004 08:27 AMOne of the most interesting applications on the IEM website is the RWIS time traces. This application allows you to plot current or historical traces of air and pavement temperatures for a site and time period of your choice. The past few days have produced very interesting data traces as the mixed precipitation and cold temperatures have produced slick driving conditions.
Tags: rwis