Past IEM Features tagged: qq
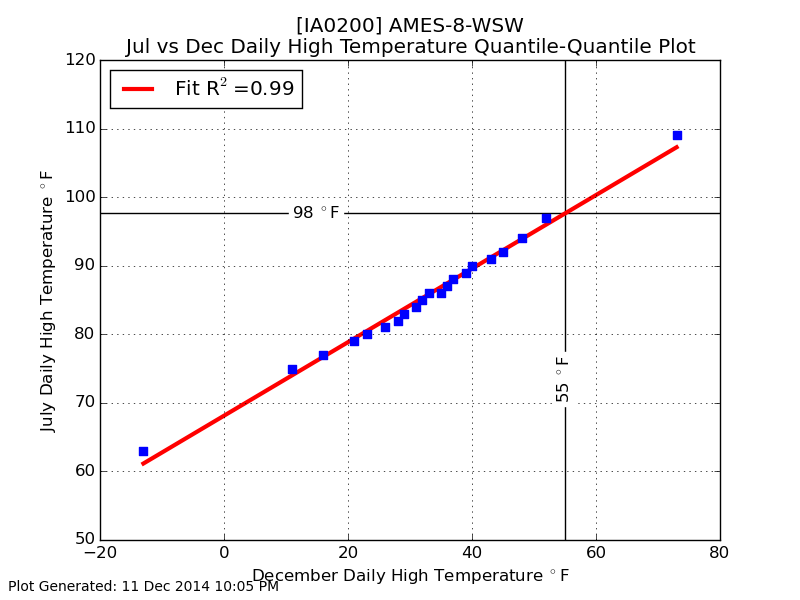
55 is like 98
12 Dec 2014 05:43 AMThe forecast continues to hold out hope for 50s this weekend. How exceptional is this warm of a high temperature in December? The featured chart is called a quantile quantile plot, which compares identical quantiles for two populations. In this case, the daily highs for July and December are compared for Ames. Each dot represents the same quantile for each populations and the red line is a least squares fit for dots. The correlation coefficient is nearly one, which indicates that the two populations have a very similarly shaped distribution. So for comparison, having a high temperature of 55 in December is like having a high temperature of 98 in July.
Voting:
Good: 30
Bad: 24
Abstain: 17
Tags: qq climate
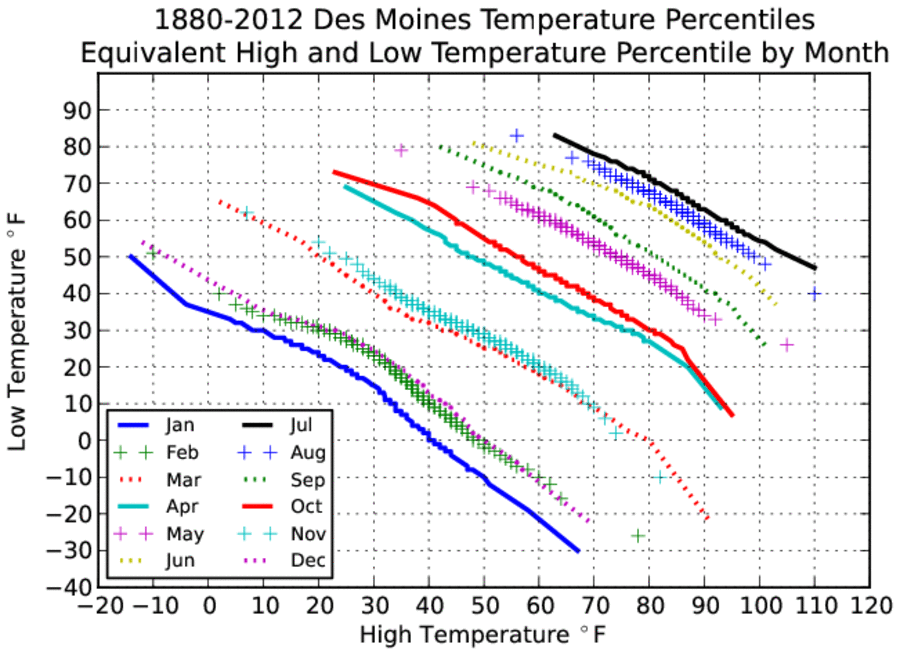
High + Low Percentiles
28 Jul 2013 07:46 AMThe low temperature dipped to 51 degrees for Des Moines on Sunday morning, which set a record low temperature. How common is this cold of a temperature in July? The featured chart presents a means by which low temperature frequencies can be compared to high temperature frequencies by equating their respective percentiles. A line is shown for each month of the year. So for July, the 51 degree low temperature compares with a high temperature around 104. Restating, Des Moines has about the same number of days at or below 51 degrees for a low temperature as it does for having a high temperature at or above 104. So you could say the weather this morning is as common as a high of 104!
Voting:
Good: 118
Bad: 13
Tags: qq climate highs lows