Past IEM Features tagged: phase
Ending up where we started
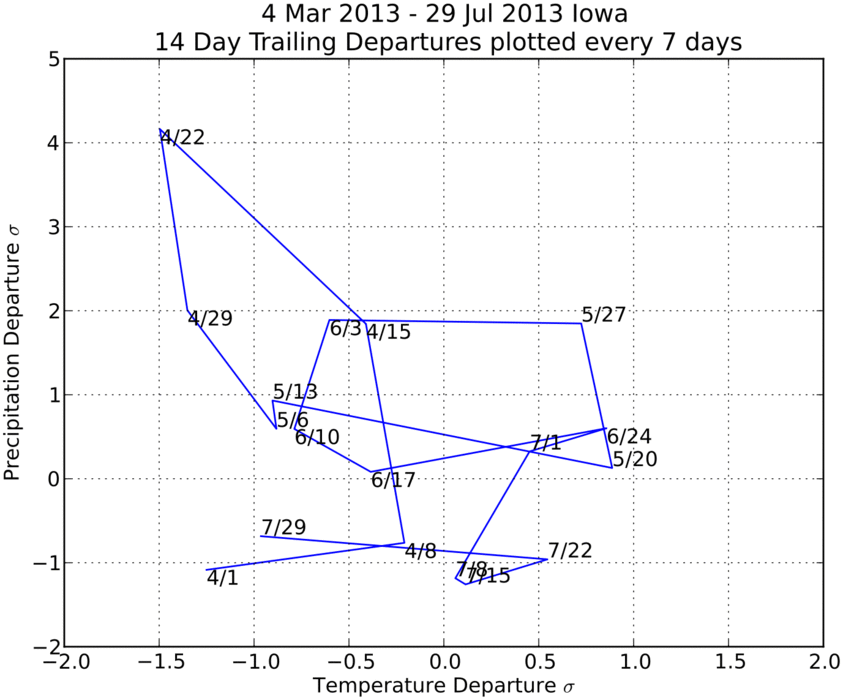
30 Jul 2013 04:25 AMThe featured chart presents a time series of trailing 14 day departures of temperature and precipitation for Iowa. The line connects this metric computed every seven days and the points are labelled for the end of the 14 day period. The start of the line is on the first of April and the line ends with today. The chart shows that our past two weeks closely resemble the two weeks ending on 1 April with cool and dry weather. These types of plots often create loops when the variables are correlated. Our next period of weather looks to continue the dry weather, but closer to average temperatures are expected.
Voting:
Good: 76
Bad: 7
Tags: phase

Weather Phases
23 Apr 2013 05:38 AMWith snow once again visiting the state, our recent stretch of weather has certainly been on the wet and cold side of average. How did we get to this point? The featured chart is sometimes called a phase plot and is often used to explain business cycles. Is this context, the line traces a time-series of 14 day temperature and precipitation departures since November 2012. There is a nice property of these plots as they tend to make loops as physical processes in our atmosphere interact on timescales longer than one day (think passing series of storm systems and air mass regime changes). By normalizing the axes to standard deviation departures from average, the time-series is constrained and will nicely oscillate around within the plot as temperature and precipitation departures somewhat correlated. Anyway, you can see the large jump we have recently taken to over 4.0 SD on precipitation and -1.5 SD on temperature! From here, we have to loop back to somewhere at least drier (we are currently at a precipitation extreme) and hopefully warmer. Thankfully, the forecast is hinting at just that with warmer weather for this weekend and less rain.
Voting:
Good: 58
Bad: 11
Tags: phase