Past IEM Features tagged: persistence
Persistent Temperatures
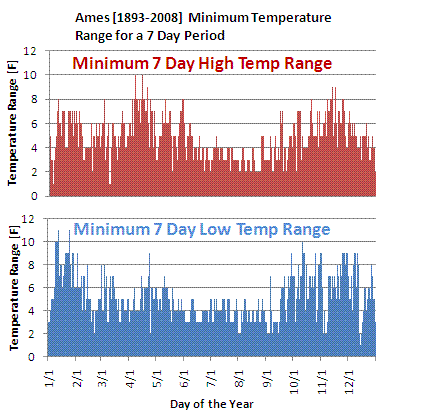
12 Sep 2009 07:38 AMThe past week or so has seen high temperatures not vary much for Ames with the range being a mere 3 degrees (78-81). The featured chart looks at the minimum 7 day temperature range for all days of the year. In general, the lowest values are in the summer time when strong temperature fronts are not common. The spikes during the spring and fall months are when we often experience air mass changes via strong fronts.
Voting:
Good: 8
Bad: 12
Tags: persistence highs lows
Forecasting the High Temp
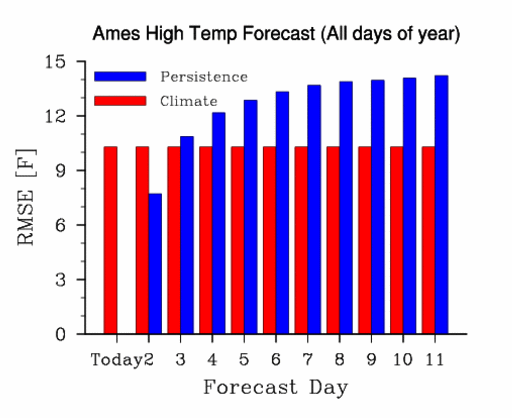
10 Oct 2008 06:05 AMThere many techniques that can used to generate a weather forecast for high temperatures. The errors associated with two of these techniques are shown in the featured chart. A "persistence" forecast is simply saying that today's high temperature will be tomorrows and then the next day and ... One version of a "climate" forecast is simply saying that the high temperature will be the average high temperature for the given day. Averaged over a year, the climate forecast will have nearly the same daily error, since it is a measure of the spread of the variability. The persistence forecast gets progressively worse over time as weather and climate effects change the local conditions. Note that the persistence forecast is better for day 2 and close for day 3. Also note that the persistence forecast for day 1 is zero, since the persistence forecast for today is the observation for today.
Voting:
Good: 37
Bad: 23
Tags: persistence
Tomorrow's tomorrow is not like today
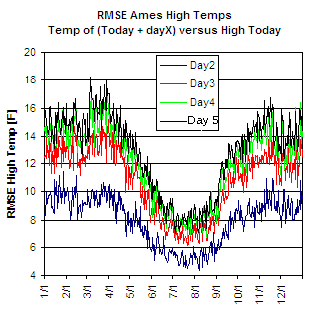
28 Sep 2007 07:38 AMThe featured plot attempts to show the persistence (or lack thereof) of day to day high temperatures throughout the year. The four lines represent the root mean squared error (RMSE) of the difference between high temps for a date versus the high temp for a date so many days into the future! Confusing, eh? What this plot is showing is persistence of high temperatures in time. The lowest RMSE values are for day2, which makes sense as tomorrow is more likely to be similiar today than the day after tomorrow. The RMSE values increase for day4 and day5, but are similiar in value. During the year, you can see the lowest values in the summer, which is due to the lack of strong cold fronts providing temperature contrasts. The jump in values in September shows the influence of stronger fronts as the seasons change.
Voting:
Good: 26
Bad: 8
Tags: persistence


