Past IEM Features tagged: percentile
2020 Low Temp Percentiles
15 Apr 2020 03:53 AMTemperatures have been a struggle this week. The low temperature for Cedar Rapids on Tuesday tied a record at just 20 degrees. The featured chart presents the daily low temperature percentiles this year. The bars are colored based on their value with 100 representing the warmest value for the date. We have seen our share of dates this year above the 90th and below the 10th percentile. The good news is that a warming trend is in the forecast with highs next week expected back above average.
Voting:
Good: 10
Bad: 1
Tags: percentile
High Temperature Profile
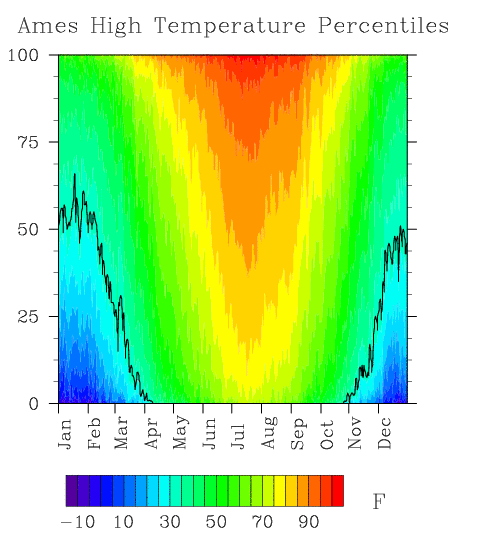
05 Feb 2009 06:23 AMThe featured plot is of daily high temperature percentiles from Ames based on data for the past 100 years. The plot provides a colorful look at the climatology of Ames. The black line is the 32°F contour. For February, this contour rapidly decreases, which implies that our chance for having a high temperature above freezing is rapidly increasing. The forecast calls for temperatures above freezing for most of the state and even thunder showers expected next week.
Voting:
Good: 15
Bad: 11
Tags: percentile climate
Temperature percentiles
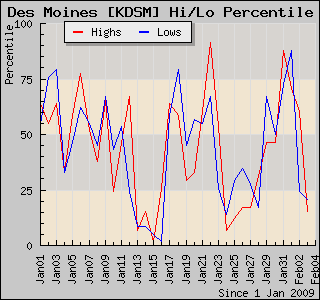
04 Feb 2009 06:19 AMThe featured chart is a time series of daily high and low temperature percentiles. Based on historical temperatures, a percentile quickly shows the percentage of observations above and below the actual value for the day. It is effectively a way to rank the observation. The exceptional cold around 15 January sticks out in this plot with a repeat period toward the end of the month.
Voting:
Good: 16
Bad: 6
Tags: percentile


