Past IEM Features tagged: metar

Light Snow Days
22 Jan 2020 05:34 AMThe featured chart presents the number of days each month that had at least one report of light snow from the weather observations at the Des Moines Airport. The period of record average is shown along with the current 2020 accumulation. Today's snow event will likely put this year above average for this metric during January and the forecast has a number of chances for further light snowfall days to be accumulated.
Voting:
Good: 13
Bad: 0
Abstain: 2
Tags: metar
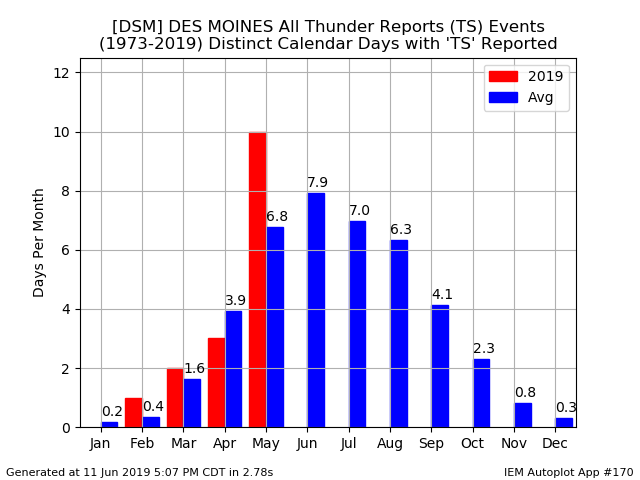
No June Thunder Yet
12 Jun 2019 05:34 AMFor the Des Moines airport weather station, there has yet to be a thunder report within available METARs for the month of June. The featured chart presents the average number of days with at least one hour per month with TS (thunderstorms) mentioned within the METAR reports and the totals for 2019 so far. June is the most frequent month for storms, but so far good moisture and instability have been lacking. There is a chance of thunderstorms today and again for the upcoming weekend.
Voting:
Good: 7
Bad: 0
Tags: metar

Days with Fog Reported
14 Nov 2017 05:33 AMDense Fog was common over Iowa on Monday. The featured chart presents the number of days each month that at least one hourly report of Fog was made for the Des Moines Airport. This is based on the archive of hourly METAR reports from the site. Of course, not all days that report Fog are dense enough to warrant advisories, like those issued on Monday. The blue bars are the simply monthly average for period of record and red are so far this year. For the year, this chart would indicate the number of days with fog reported to be below average.
Voting:
Good: 9
Bad: 1
Tags: metar
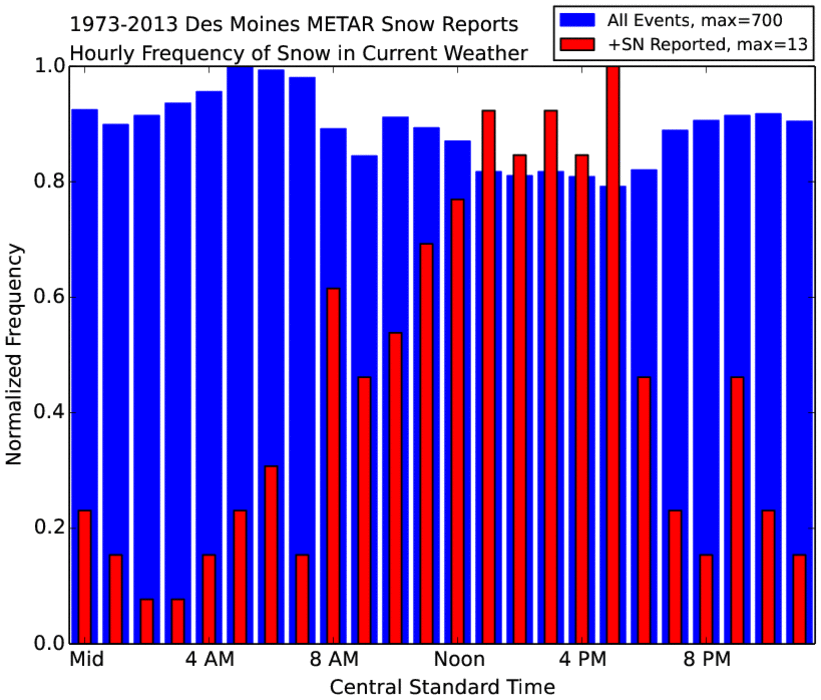
Hours for Snow
13 Feb 2014 05:47 AMFor rainfall, it is well established that Iowa experiences two peaks in hourly frequency. One is in the early morning hours associated with a phenomena known as the low level jet and the other, in the very late afternoon/evening hours associated with the heating of the day driving storms. For snowfall, the forcing is a bit different and the featured chart presents the hourly frequencies of having snowfall reported by the Des Moines Airport sensor. The peak shown for all events is during the coldest time of day (right before sunrise), which would be the best odds that a precipitating storm could have temperatures cold enough to support snow. That is not the entire story though as the smaller bars depict when the most intense snowfalls are reported (coded +SN in the reports). These intense events have a clear diurnal pattern with the maximum in the late afternoon hours. It is not entirely clear why this is, but a logical explanation is that convective snow (like what we experienced in mid January) is enhanced and perhaps forced by daylight heating. While the bars are normalized, you should notice the large difference in frequency between the intense +SN events and all snow events.
Voting:
Good: 32
Bad: 12
Abstain: 4
Tags: asos snow metar