Past IEM Features tagged: jul11

Still featuring July
10 Aug 2011 10:20 PMIt is hard not to keep featuring interesting stats from July after such an exceptional month! The featured chart displays the July high and low temperature departures from long term average for Des Moines. The bottom plot displays the monthly high versus low departure with a good correlation of 0.6 shown, which means warm highs usually mean warm lows and vice versa. The red dot on the scatter plot shows how exceptional this year was for low temperature.
Voting:
Good: 10
Bad: 6
Tags: jul jul11

Unequally warm July
09 Aug 2011 07:08 PMNOAA recently released estimates of July average temperatures and put this year as the 7th warmest on record for Iowa. The featured chart presents an analysis of hourly temperature departures and percentiles based on hourly data for Des Moines. The plot clearly shows the most exceptional temperatures occurring during the night time hours, which indeed tells the story of this month having very warm low temperatures. This was a result of the record amount of humidity in the state this July helping to keep temperatures warm overnight. Based on some IEM calculations: this July was the warmest on record for low temperatures statewide, but only the 40th warmest for highs (since 1893). The average of those two values gets us to 7th warmest.
Voting:
Good: 14
Bad: 5
Tags: jul jul11
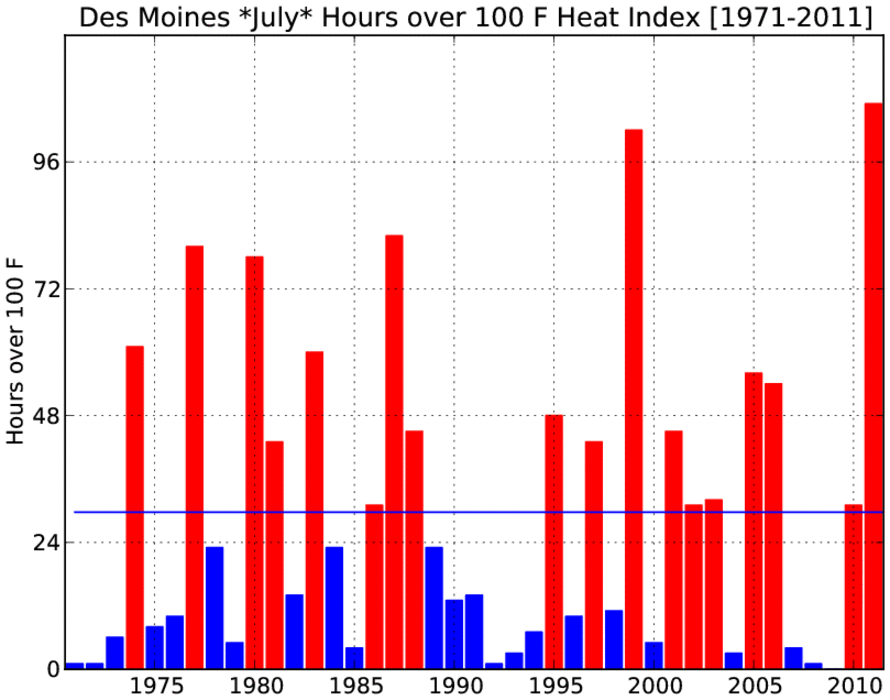
Steamy July
01 Aug 2011 05:45 AMThankfully, July of 2011 is history, but the heat and muggy weather looks to continue. The featured chart presents the number of hours during July for the past 40 years that the heat index was above 100 degrees for Des Moines. This year's total comes in slightly higher than 1999. The average during this period is just over 28 hours as shown by the blue line.
Voting:
Good: 19
Bad: 2
Tags: jul11 jul

July percentiles
28 Jul 2011 05:54 AMThe warm and muggy July rolls on with low temperatures again in the mid to upper 70s this Thursday morning. The featured chart presents the daily high and low temperature percentiles so far this month. The low temperatures really stand out with most of the days this month shown well average and near the 100th percentile. The forecast for the rest of July continues this trend with only slightly cooler overnight temperatures expected until this weekend.
Voting:
Good: 43
Bad: 7
Tags: jul11
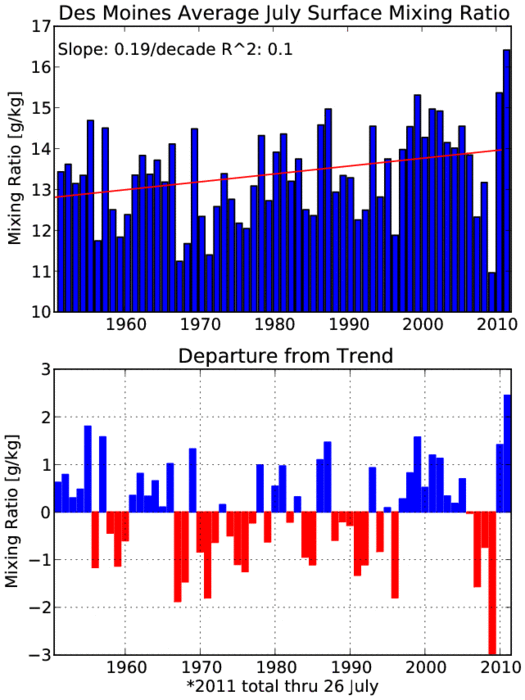
More Humid than the rest
27 Jul 2011 05:58 AMThis month has seen a remarkable amount of humidity in the area as shown by the featured chart comparing average mixing ratio for July since 1951 at the Des Moines Airport. Last year had been the previously most humid for July, but this year has soundly beat it by a full gram! Of course, there is still a few days left in this July, but judging by the forecast, the sticky weather looks to stick around until the end of the month.
Voting:
Good: 39
Bad: 6
Tags: jul jul11

Warm July Nights
26 Jul 2011 05:52 AMThis July has been one of the warmest we have seen in a very long time. As measured by average daily low temperature, this year comes in second behind 1936 based on IEM statewide estimated data as shown by the featured chart. Years above average are shown in red and the 1930s really stand out. One reason why overnight lows have been so warm is the vast amount of moisture in the air this month (more on this tomorrow). The warm weather is expected to continue until the end of the month.
Voting:
Good: 56
Bad: 3
Tags: jul11 jul
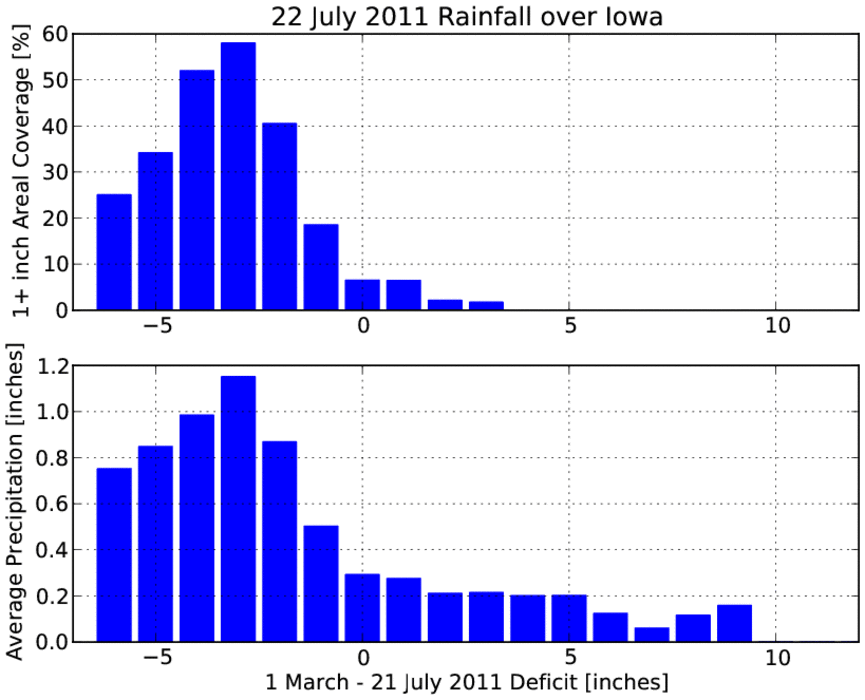
Getting rain where we needed it
23 Jul 2011 12:54 PMFriday's rainfall was a very welcome relief to some areas of the state that have been on the dry side this year. It also came at a perfect time for the pollinating corn crop in the state. The featured chart looks at how proportional the rainfall was over areas that needed it the most. Indeed, the heaviest amounts fell more proportionally over the areas with the deficits. The top chart shows the portion of the area with a deficit that got over an inch of rain. So over half of the area with a 3 inch deficit since March got over an inch of rain! The bottom chart is simply the average rain over the area with a given deficit.
Voting:
Good: 10
Bad: 5
Tags: jul11
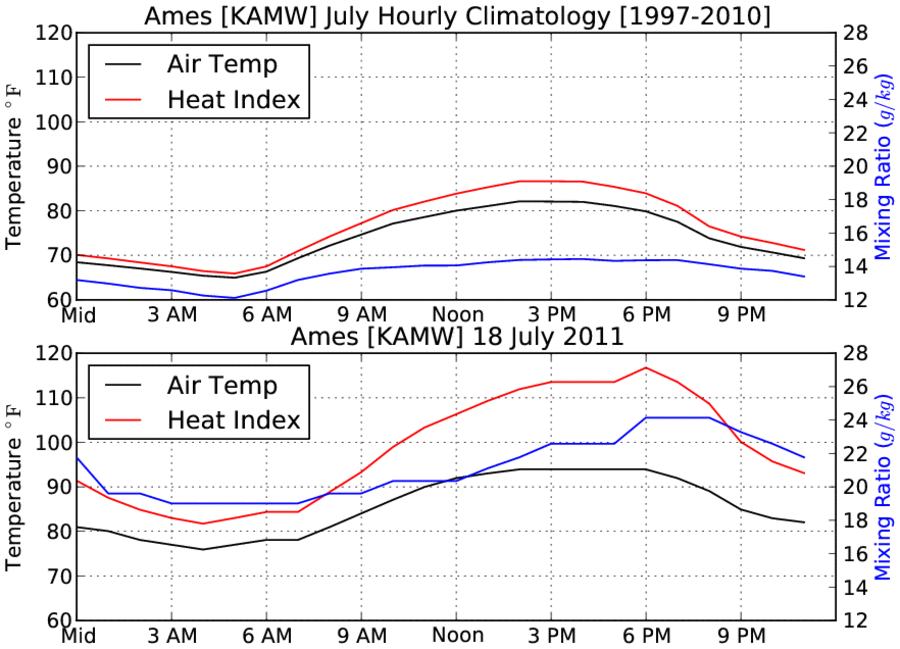
July comparison
20 Jul 2011 05:55 AMThe featured chart presents an hourly climatology of temperature, heat index, and humidity (mixing ratio) in July for Ames along with the observations from Monday. The mixing ratio is a measure of the amount of water within a unit mass of dry air. The top chart shows average mixing ratios in the 12-14 range, whereas observations on Monday were in the 19-24 range (blue line). Notice what happens in the last afternoon around 6 PM. While the air temperature was flat for the afternoon, humidity levels kept rising and pushed the heat index well above 110 degrees. This effect was probably heavily influenced by all of the corn transpiring water throughout the day. The hot and muggy weather will continue today.
Voting:
Good: 13
Bad: 4
Tags: jul11
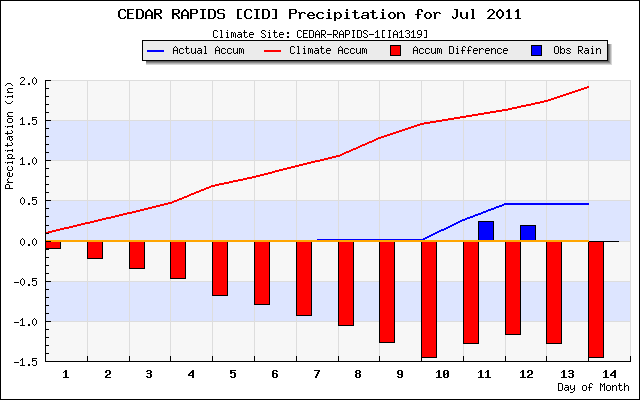
Continued dry for July
14 Jul 2011 07:03 AMThe featured chart presents daily precipitation totals and the departures from average for the Cedar Rapids Airport sensor. Rainfall this month has been not been widespread and most of eastern Iowa has missed out on the heavier events. There are more chances of rain in the forecast, but this weekend looks to start a very hot and dry period in the state.
Voting:
Good: 12
Bad: 13
Tags: jul11