Past IEM Features tagged: heatindex
2020 Heat Totals
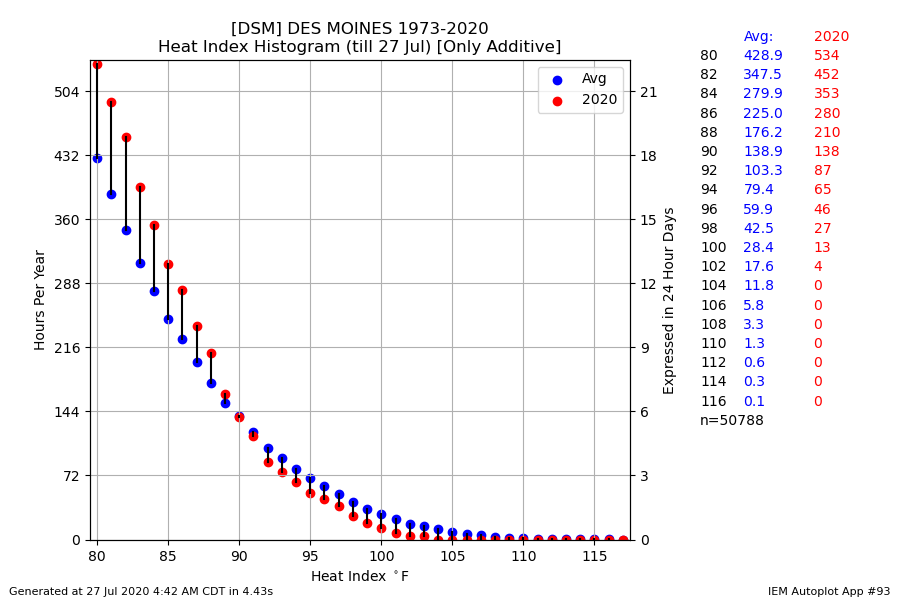
27 Jul 2020 04:48 AMLast week ended on a hot and muggy note with heat indices near 100 degrees. So it is a good time to check in on accumulated hours above a given heat index value so far this year as shown by the featured chart. A simple long term average is computed along with this year's values for the year to date period. While this year has seen more than an average amount of hours above values less than 90, the opposite is true for hotter values with 2020 lagging long term averages. You may wonder how such a combination is possible. We have just seem more warm, but not too hot, days than usual this year. Such weather looks to continue this week.
Voting:
Good: 9
Bad: 0
Tags: heatindex

Heat Index Chart
19 Jul 2019 05:24 AMUnlike Wednesday, storms were not able to save the state from oppressive heat and humidity Thursday afternoon with the entire state reaching at least 100 degrees for heat index. The heat index is a rather interesting expression of how miserable it is outside. It is an estimate that has many caveats and assumptions. There are many different heat index equations out there in the wild. The featured graphic, which you are free to use, presents the NWS Heat Index equation values for a given temperature and relative humidity. The chart is capped at about 137F as while heat index values are calculated with larger values, there is a matter of practicality if those large of values are accurate or are even obtainable.
Voting:
Good: 20
Bad: 31
Tags: heatindex

Heat Headlines
12 Jul 2018 05:32 AMThe heat and humidity weather knobs are again turned well to the right with heat index values expected above 100 degrees for much of the state today. Accordingly, the NWS has a Heat Advisory covering most of the state. The featured chart presents the frequency of the NWS having a heat related headline active for Story County (where the Ames Airport weather station resides). This frequency is based on hourly reports and the major caveat is that having a very hot instantaneous index does not necessarily warrant a headline issuance by the NWS. These headlines typically require a consecutive stretch of hours with high heat indices along with little overnight relief. Heat impacts tend to be cumulative as prolonged exposure to heat decreases resilience.
Voting:
Good: 8
Bad: 0
Tags: heatindex
Above and Below Heat Hours
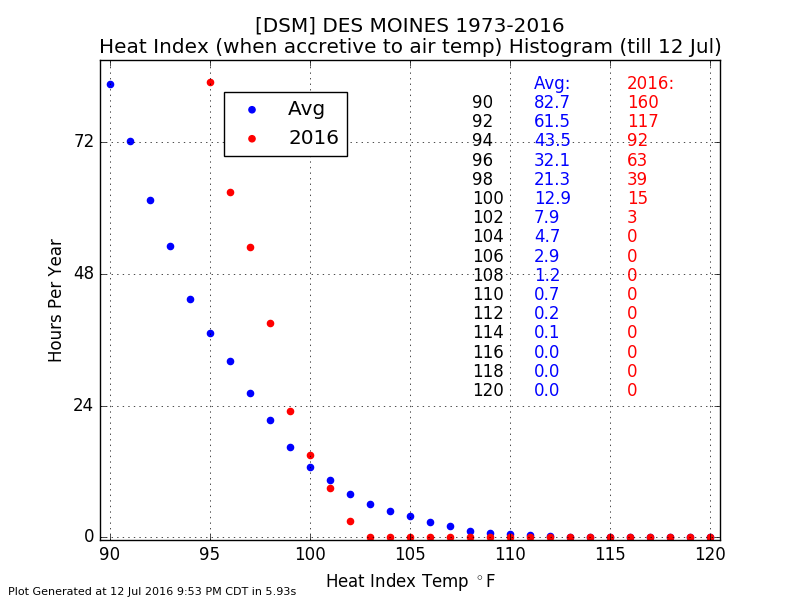
13 Jul 2016 05:37 AMThe featured chart displays the accumulated number of hours where the heat index was above a given value. This only includes hourly reports whereby the heat index was warmer than the temperature. For Des Moines, this chart tells an interesting story when compared with simple year to date averages since 1973. For heat index values between 90 and 100, we are above average, but below average for warmer values over 100 degrees.
Voting:
Good: 11
Bad: 1
Tags: heatindex

Heat Index Hours
07 Aug 2015 05:45 AMThe featured chart presents yearly number of hours that the heat index was at or above a given temperature. The hourly observations reported by the automated weather stations are assumed to persist for that local hour of time. The blue dots represent yearly averages while the red dots are actual totals for this year. Of course, this year has plenty of summer left, but totals so far are about half of normal. For this chart, the heat index is only included when its computed value is equal to or greater than the actual air temperature. You can generate this chart for other sites in the country to compare with Des Moines shown in the featured chart.
Voting:
Good: 23
Bad: 14
Abstain: 9
Tags: heatindex
Humidity Effect
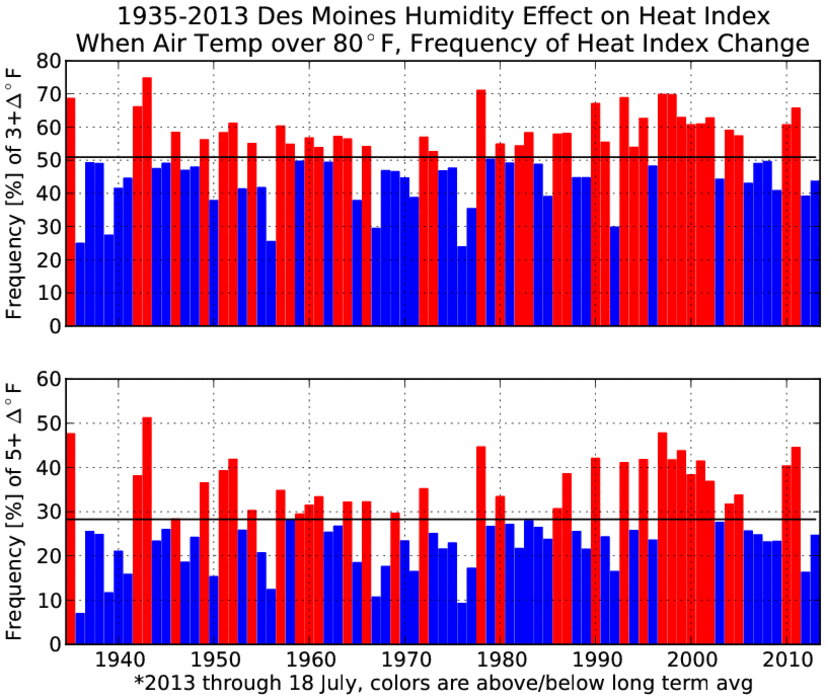
19 Jul 2013 05:39 AMThis week has a warm and muggy one with heat indices pushing 100 degrees in some locations. The popular phrase, "it isn't the heat, its the humidity", means that warm temperatures are bearable unless high levels of humidity exist at the same time. The featured chart presents the frequency of having either a 3+ or 5+ difference between the temperature and heat index when the air temperature is at or above 80 degrees. This "humidity effect" indicates how often the humidity levels are high enough to produce a noticeable difference from the temperature. Long term averages are shown for each value with bars above or below average colored separately. For Des Moines, about 50% of the time when temperatures are above 80 the heat index is adding at least three degrees to the temperature. The average is just below 30% for a five degree change.
Voting:
Good: 115
Bad: 16
Tags: heatindex
Hotter Weather Coming
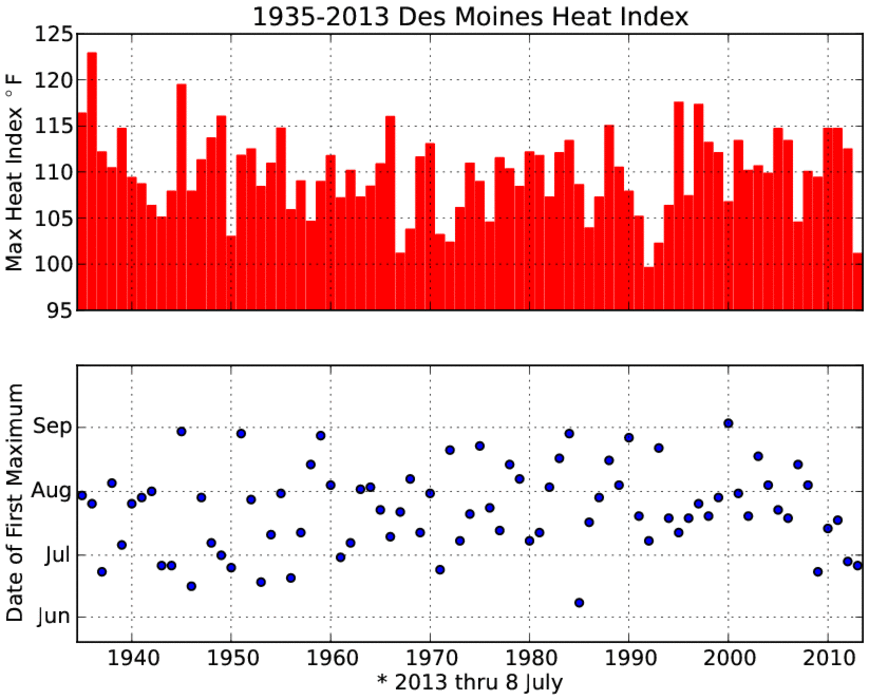
09 Jul 2013 05:27 AMThe featured chart presents the yearly maximum heat index and date of maximum for Des Moines since 1935. This year's maximum barely exceeded 100 degrees and would be one the lowest minimums on record if it stood for the rest of the year. But it is only the second week of July and as the bottom chart shows, most years experience its hottest heat index sometime in July and August. Today looks to be a very hot day with heat index values for Des Moines expected in the 100s.
Voting:
Good: 125
Bad: 6
Tags: heatindex

View larger image
heat index equation from Stull, Richard (2000). Meteorology for Scientists and Engineers, p. 60.
Heat Index
19 Jun 2013 05:37 AMThe Heat Index has not been a prominent topic so far this summer as temperatures have been cool and the warm days have mostly seen limited humidity levels. The featured chart attempts to provide a climatology for heat index for Des Moines. The contours on the plot are the temperature difference the heat index is from the air temperature. For example, at 90 degrees and 50% relative humidity the heat index adds two degrees to the temperature. The color pixel values are the relative frequency of the given relative humidity at the given temperature, meaning that each column has a sum of 100%. The point of the plot is to show the most common combinations of temperature and relative humidity along with the heat index that produces. Thankfully, as the temperature increases the relative humidity tends to decrease which limits the heat index (the water content of the air does not change only the water holding capacity). The chart also indicates that the heat index is rarely adding over 14 degrees to the temperature and typically something less than 6 degrees. The forecast has some of the warmest heat index values of the year so far set to arrive this weekend.
Voting:
Good: 58
Bad: 5
Tags: heatindex
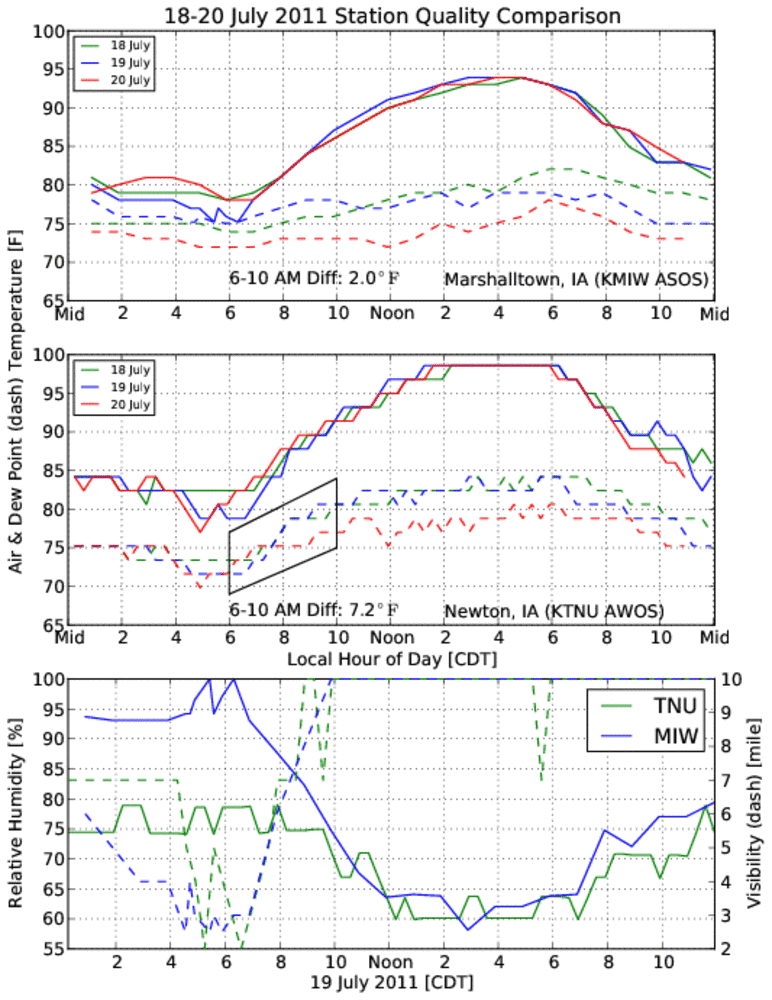
Unreliable Dew Points
21 Jul 2011 12:33 AMOur recent stretch of extremely hot and muggy weather has gotten Iowa a bit of publicity as some of our automated stations have calculated heat indexes that exceeded 130 degrees! Typically, this is blamed on the abundant transpiring corn crop in the state, but that is not the entire story. The primary source of automated weather data in the state are located at airports, but there are two classes of instruments. The federally administered ASOS sites have higher quality and sometimes different sensors than their state run AWOS counterparts. Unfortunately, their data is typically thrown together in the same pot and reported as such. While the ASOS sites did indicate gaudy heat indexes exceeding 110 at times, they were not as high as the AWOS sites which got all the headlines. The featured chart presents a comparison of an ASOS and AWOS site separated by 30 some miles and both surrounded by farm fields. The bottom plot raises the most doubt as even while visibilities were at 2-4 miles, relative humidity was just 75% at the AWOS site and near 100% at the ASOS site. This is probably an indication that the AWOS air temperature has a warm bias. The second plot shows another issue of having the AWOS dew point rise dramatically during the morning hours at a much higher rate than the ASOS site. It is hard to imagine a natural process that could be putting that much water into the atmosphere in the early morning hours. The first plot of the ASOS site shows a reasonable depiction of transpiring corn (slowly rising dew point throughout the day peaking late afternoon coinciding with plant transpiration), but the dew point temperature barely gets to 80 degrees which keeps the calculated heat index at reasonable values. The moral of the story is that not all automated sensors are alike and while heat indexes over 110 surely were felt in Iowa these past days, the high end values over 120 are questionable.
Voting:
Good: 54
Bad: 5
Tags: awos heatindex dewpoint

It is that time of year
18 Jul 2011 05:57 AMHeat index values soared to well over 100 degrees this past weekend thanks to highs in the 90s and dew point readings in the upper 70s and lower 80s. The featured chart presents frequency of having a 100+ heat index by hour and week of the year based on observations from the Des Moines sensor. The bullseye is right about now, the third week of July which is also the warmest week of the year. The very hot weather looks to continue this week.
Voting:
Good: 14
Bad: 6
Tags: heatindex
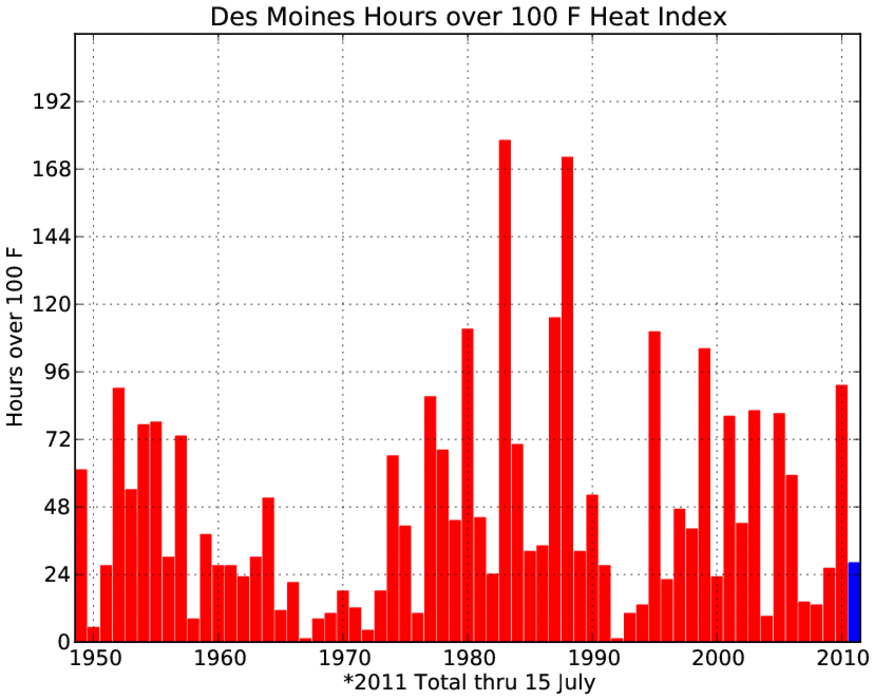
More hot hours ahead
15 Jul 2011 03:30 PMThe big story is the forecasted upcoming hot weather to begin this weekend and last into at least next week. The featured chart presents the number of hours per year that the heat index was observed to be at or above 100 degrees at the Des Moines sensor. The 2011 total is already above four of the past seven years. This weather will be right on time for the climatological warmest week of the year as well.
Voting:
Good: 13
Bad: 15
Tags: heatindex