Past IEM Features tagged: gas
Gas Mileage
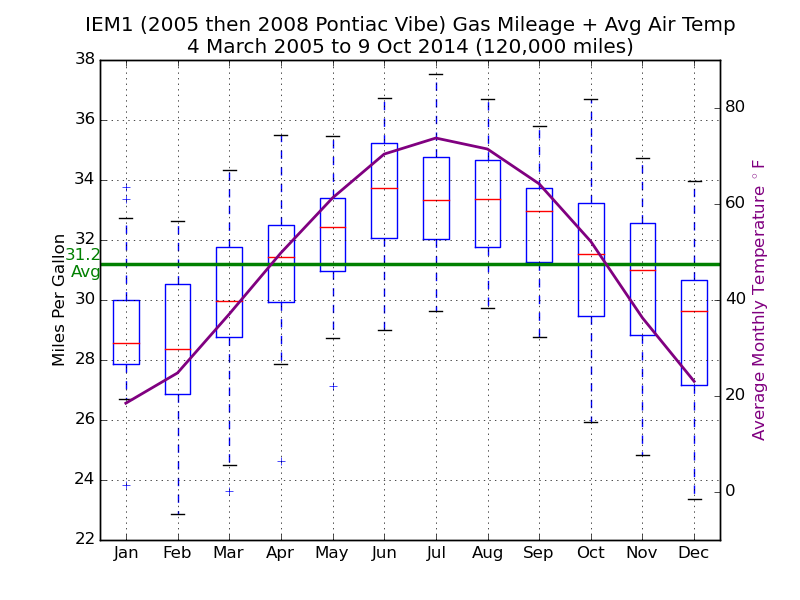
10 Oct 2014 05:39 AMThe featured chart presents a summary of the primary IEM fleet vehicle's (IEM1) gas mileage and the monthly temperature climatology. Is there a relationship? The gas mileage is presented by monthly box and whisker plots showing the mean, range between 25th and 75th percentile, and the range is shown by the whiskers. The chart shows a clear annual signal with mean monthly gas mileage varying by +/- 10%. Is temperature the simple reason why this phenomena happens? The decline in the cold season is due to a number of factors related to temperature, these include decreased tire pressure, winter blend fuels being less energetic, battery and alternator inefficiencies, excessive idling to "warm up the car", and driving inefficiencies related to snow and ice.
Voting:
Good: 30
Bad: 22
Abstain: 9
Tags: car gas