Past IEM Features tagged: dewpoint

August Dew Point Percentiles
18 Aug 2022 05:41 AMAfter some hot and muggy weather to start off the month, the past week to ten days have seen rather pleasant August weather with comfortable temperatures and dew points. The featured chart presents August dew point percentiles for Ames. The top panel shows the percentile climatology by hour and needs some plotting help to make it more useful! The bottom panel is more interesting and displays the hourly dew point percentile values this year during August. The percentiles are computed for each hour of the month. The side panel on the bottom plot shows a histogram of these values which gives an indication of the amount of time Ames has spent at a given decile range this month. So the moral of the story here is that we have majority of time this month below the 50th percentile for dew point.
Voting:
Good: 10
Bad: 0
Tags: dewpoint
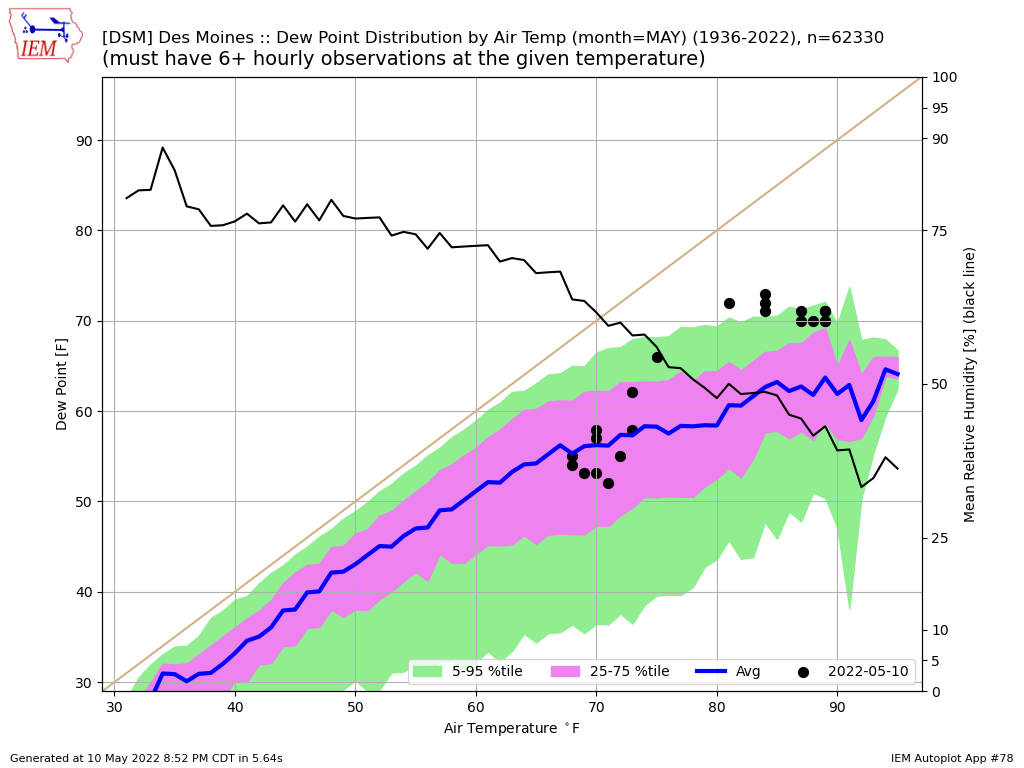
May Dew Points
11 May 2022 05:31 AMYour location in Iowa on Tuesday likely made a big difference of your opinion of the weather! A staled out surface boundary split the state nearly in half with the southeastern half stuck with mid-summer quality steamy heat and the northwestern half experiencing Chamber of Commerce weather. The Des Moines airport was in the former half. The featured chart presents a climatology of dew point temperature by air temperature during May. The blue line represents an average dew point as computed via a mixing ratio calculation with the black line showing the associated relative humidity with that calculated dew point value. Percentile ranges are shown as well to give a handle on the distribution. To add more content to the plot, actual observations from Tuesday are included as well. The dew points over 70 are certainly at the top end of the range for the month of May. The chart nicely shows an inflection point at about 70 degrees, which is a sign of warming above that level typically lowering humidity levels due to vertical mixing and other processes. It is rather exceptional to see such high humidities this time of year.
Voting:
Good: 14
Bad: 1
Tags: dewpoint

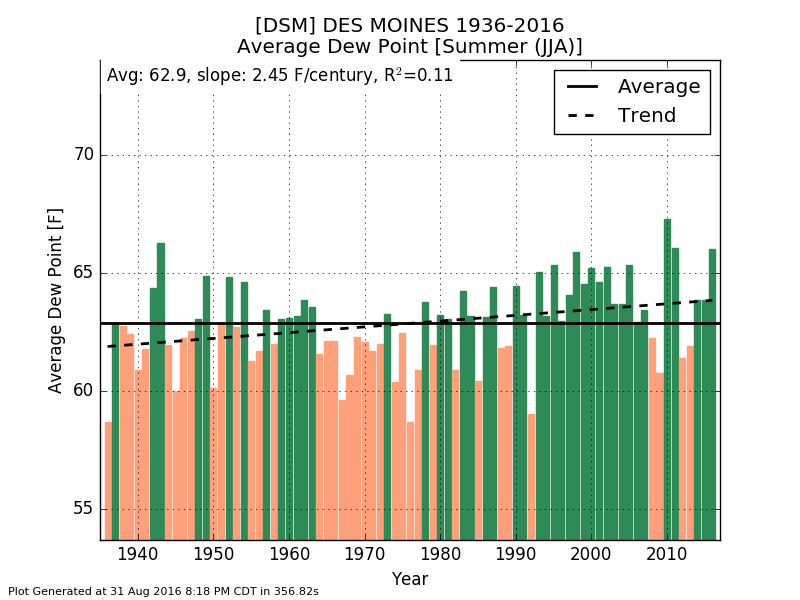
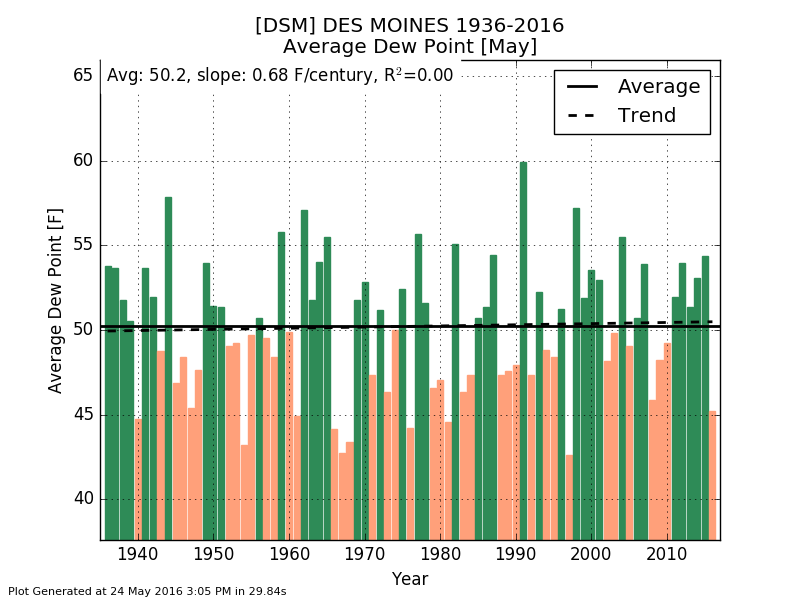
Summer Dew Point Trend
13 Aug 2019 05:28 AMThe featured chart presents an analysis of average summer (Jun, Jul, Aug) dew point for Des Moines based on available hourly observations. A simple linear regression fit is shown for the dataset and indicates an upward trend. The color of the bars indicate if the given year is above or below the simple long term average. A majority of the recent 30 years are shown to be above average. Preliminary data for this year (not shown) has this summer coming in slightly above average as well. The near term forecast has a drop in humidity for mid-week.
Voting:
Good: 15
Bad: 0
Tags: dewpoint summer
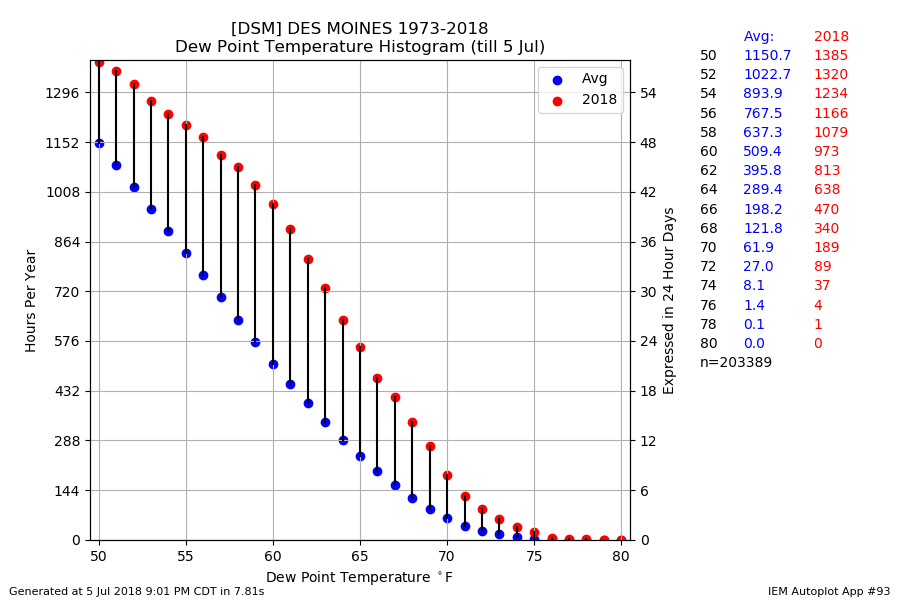
Plenty of Humidity
06 Jul 2018 05:40 AMMuch drier air is expected for this weekend, which is a welcome break from the increased humidity levels we have seen for much of 2018. The featured chart presents the number of hours this year and on average that the dew point temperature was at a given level for Des Moines. The 2018 totals are well above average. The increased humidity has certainly helped fuel heavy precipitation events so far this summer. It has also helped buoy overnight low temperatures, which have been exceptionally warm this summer. Thankfully, the break from the elevated humidity this weekend will also help over night low temperatures drop safely into the 'open your windows' range.
Voting:
Good: 13
Bad: 1
Tags: 2018 dewpoint

Finally, some humidity
02 May 2018 05:32 AMThe past few days have seen not only the warmest temperatures of the year, but also the highest dew point readings. The featured chart depicts the daily range between the minimum and maximum dew point temperature for Ames. Any day with the range at 50 or above is highlighted in red. Amazingly, only two days are shown and those are the past two days! So on April 30, it was the first day with a dew point above 50 and Tuesday was the first day above 60. At this rate, the muggiest summer dew points of 80 will be here on Thursday! It is no coincidence that all this moisture is helping to fuel thunderstorms which are bringing heavy rainfall to the state.
Voting:
Good: 8
Bad: 0
Tags: dewpoint
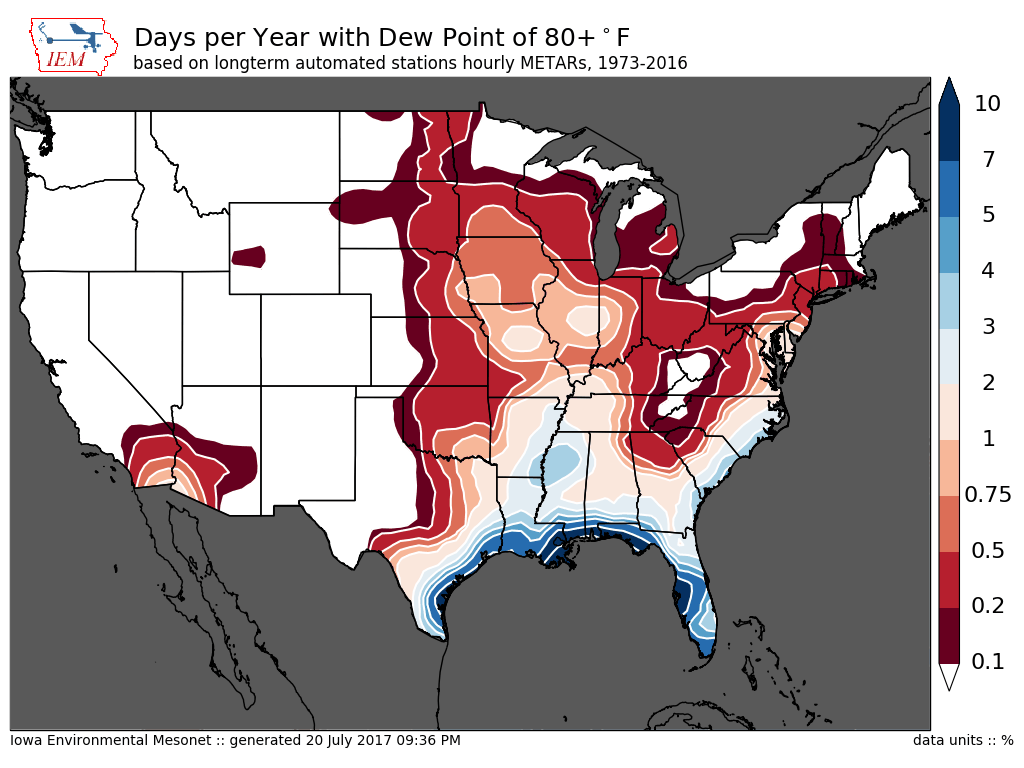
80 Degree Dew Point Days
21 Jul 2017 05:34 AMDew point temperatures got a bit excessive on Thursday with a number of observation sites in the state reporting 80+ degree readings. The featured map presents an analysis of long term hourly observation sites for the average number of days per year that the dew point reaches at least 80 degrees. The areas immediately near the Gulf of Mexico, Gulf of California, and Atlantic Ocean waters see the highest readings as water temperatures near 80 will help support such humid dew points. In Iowa, we get the transport of humid air from the south and the enhanced crop transpiration this time of year to help us reach 80 degrees.
Voting:
Good: 13
Bad: 1
Abstain: 1
Tags: dewpoint

Below Avg 60+ Dew Points
02 Jun 2017 05:37 AMOur recent stretch of pleasant temperatures and low humidities will be interrupted this weekend with a taste of summer-like conditions. Our recent low humidities have been par for the course this year as really muggy air has avoided the state. The featured chart displays the number of hours with a dew point at or above a given threshold temperature for this year and overall average for Des Moines for the year to date period. This chart shows below average values this year for levels above 60 degrees and nothing higher than 68 degrees.
Voting:
Good: 10
Bad: 0
Tags: dewpoint
Humid Summer
01 Sep 2016 05:34 AMThe meteorological summer season of June, July, and August are now in the books, so it is an appropriate time to review some stats. The featured chart displays an average dew point reading each summer based on the hourly observations from the Des Moines Airport weather station. This average is computed by averaging the mixing ratios and not a simple average of the dew point temperature. 2016's value is practically tied at 2nd place with 2011 at 66.1 degrees. 2010 is the highest in this chart at 67.3 degrees. This chart also nicely shows one of the main climate change trends in the state, which is for more humid summer seasons although not all recent summers have been on the high side of long term average.
Voting:
Good: 13
Bad: 0
Tags: summer dewpoint
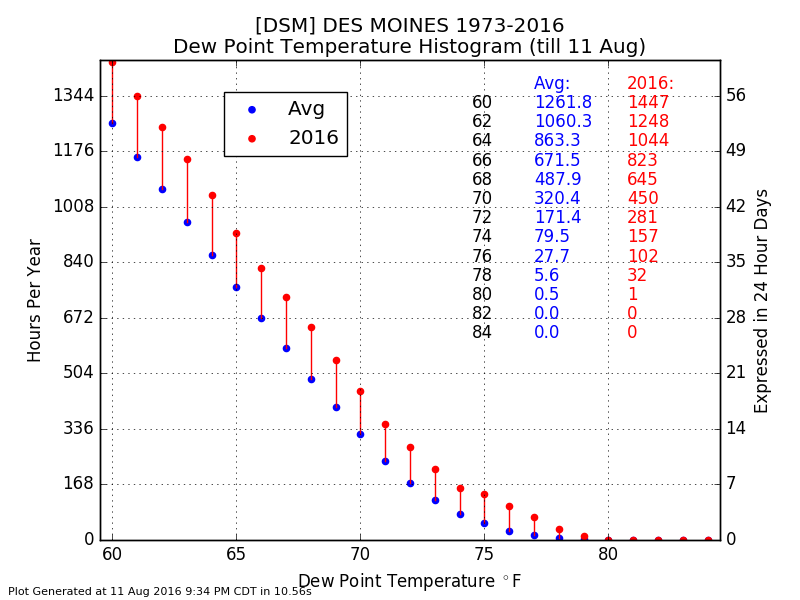
Muggy Year
12 Aug 2016 05:33 AMThursday was yet another very muggy day in the state this summer. The featured chart displays the number of hours that the hourly dewpoint temperature was at or above a given threshold for Des Moines for the year to date period. The blue dots represent the long term average since 1973 and the red dots are the 2016 totals. For example at the 70 degree level, we have spent about 33% more hours than average having a dew point at that level or higher.
Voting:
Good: 22
Bad: 1
Tags: dewpoint
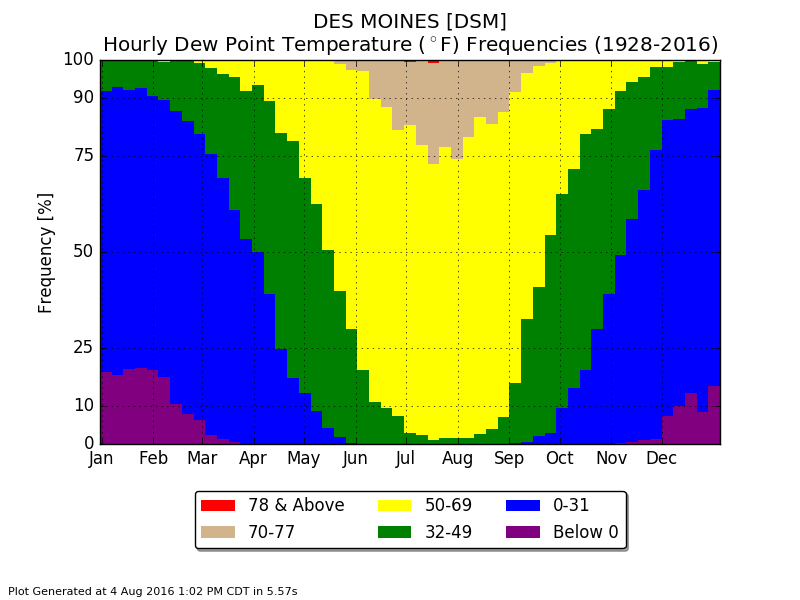
Hourly Dew Point Frequencies
05 Aug 2016 05:37 AMVery muggy air visited the state on Thursday again with dew points approaching 80 degrees in some locations. Thankfully, such extreme dew point readings are not the norm for Iowa. The featured chart presents the frequency of hourly dew point temperature observations partitioned by week of the year for Des Moines. Only a few small slivers of red appear for the top most category at or above 78 degrees. For this chart, a one percent frequency would imply one hour per 100 hours or one hour every five days. A frontal passage Thursday evening removed the very muggy air from the state, so conditions will be much more comfortable on Friday.
Voting:
Good: 10
Bad: 1
Tags: dewpoint

Hourly Dew Point Extremes
29 Jul 2016 05:30 AMIt is never too late to look back on the very humid conditions present a few days ago in Iowa. The featured chart presents the maximum dew point temperature by hour based on the hourly weather station reports. The most recent date of the hourly maximum is shown on the side with the hours with multiple dates denoted with an asterisk. A few July 2016 dates appear on the chart with a new hourly maximum set at 1 AM. Thankfully this very muggy air is gone for the moment and a very pleasant weekend is in store.
Voting:
Good: 12
Bad: 0
Tags: dewpoint
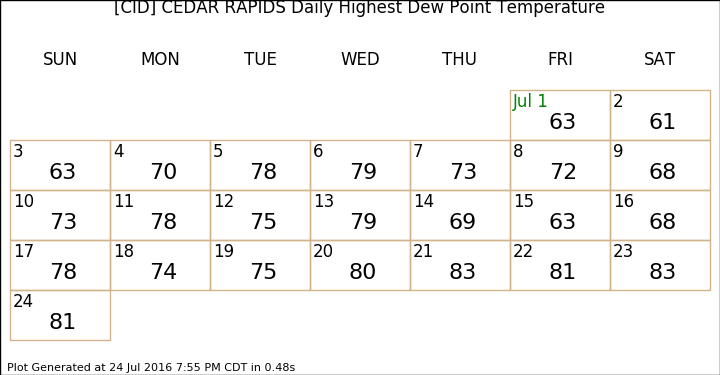
5 days of 80 Dewpoints
25 Jul 2016 05:31 AMMuch more pleasant air arrived in the state on Sunday afternoon, which ended a remarkable stretch of extremely humid weather. The featured chart displays the maximum dew point temperature as sampled by the hourly observations from the Cedar Rapids Airport weather station. The chart shows five straight days with this value reaching 80+ degrees. It is hard to find precedent for this stretch in the archives of Iowa weather.
Voting:
Good: 19
Bad: 1
Tags: 2016 dewpoint
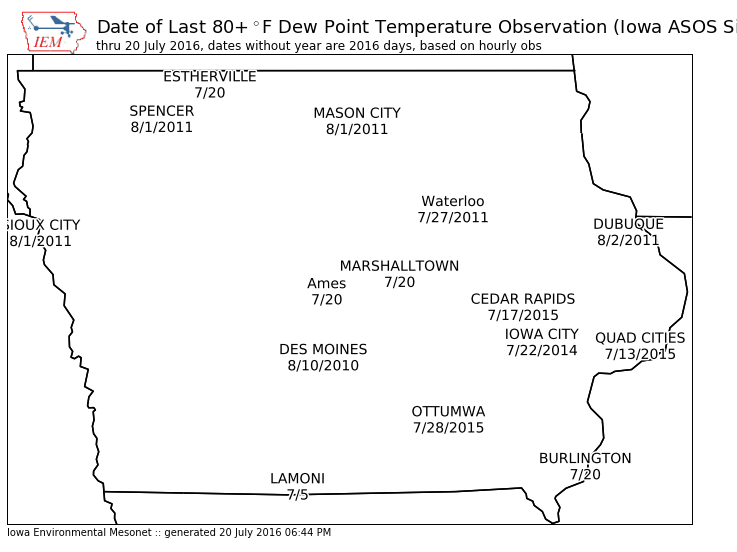
Last 80+ Dew Point
21 Jul 2016 05:41 AMThe well advertised arrival of hot and very humid conditions arrived in the state on Wednesday with heat index values pushing well above 100 degrees for most of the state. Dew point temperatures reached 80 degrees according to some of the primary automated stations in the state. The featured map presents the most recent date that a 80+ degree dew point was reported by an Iowa ASOS station.
Voting:
Good: 13
Bad: 1
Tags: dewpoint 80
Low May Dew Points
25 May 2016 04:10 AMThe muggiest air of the year so far arrived in Iowa on Tuesday with dew points well into the 60s. The featured chart displays the average dew point values for each May for Des Moines. This May so far is well below average and one of the driest values on record. There is still a week of May to go and this average value will creep upwards with the actual dew point values approaching 70 degrees later this week.
Voting:
Good: 12
Bad: 0
Tags: dewpoint
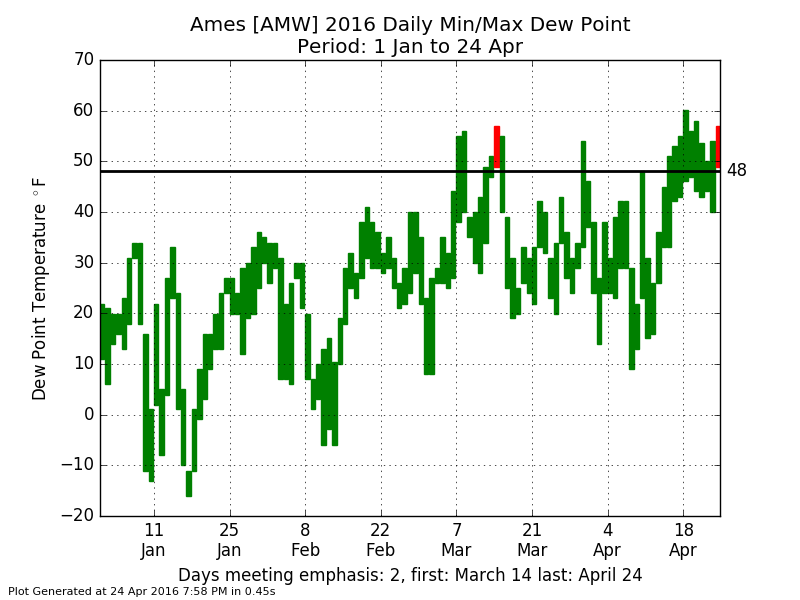
Not much for high dew points
25 Apr 2016 05:34 AMSo far this year, we have avoided the really muggy conditions that are thanks to long transport of humid air from the Gulf of Mexico. The featured chart displays the daily range of reported dew point temperature from the Ames Airport station. Sunday was only the second time this year that the dew point was above 48 for the entire day. After a few warm days to start this week, cooler weather is forecasted to arrive and persist into the start of May.
Voting:
Good: 9
Bad: 0
Tags: dewpoint
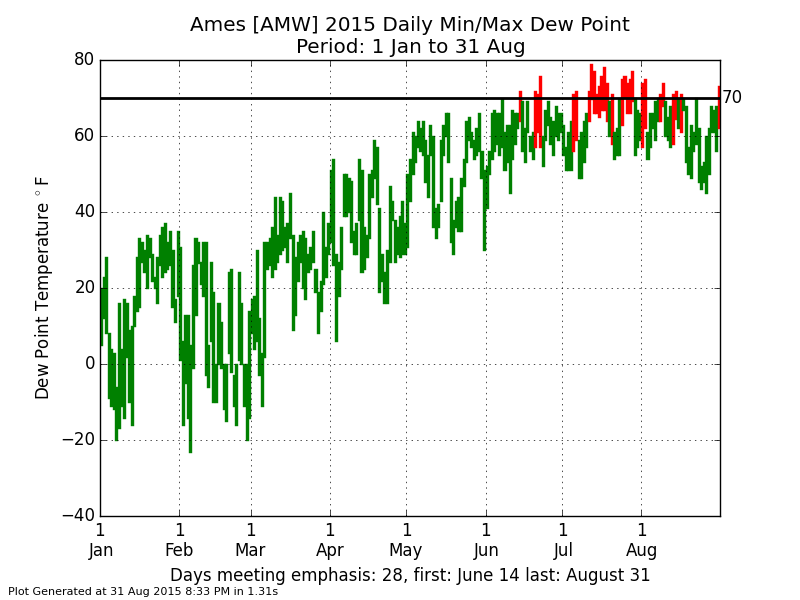
Humidity Returns
01 Sep 2015 05:34 AMAfter a considerable stretch of August that felt more like fall, the last day of August reminded us of what August should feel like with dew points returning to the muggy 70+ degree level. The featured chart displays the daily range of high and low dew point for Ames with those days with at least one observation at or above 70 degrees highlighted in red. Only a few days this August have meet the criterion and 28 days overall this year.
Voting:
Good: 13
Bad: 3
Abstain: 3
Tags: dewpoint
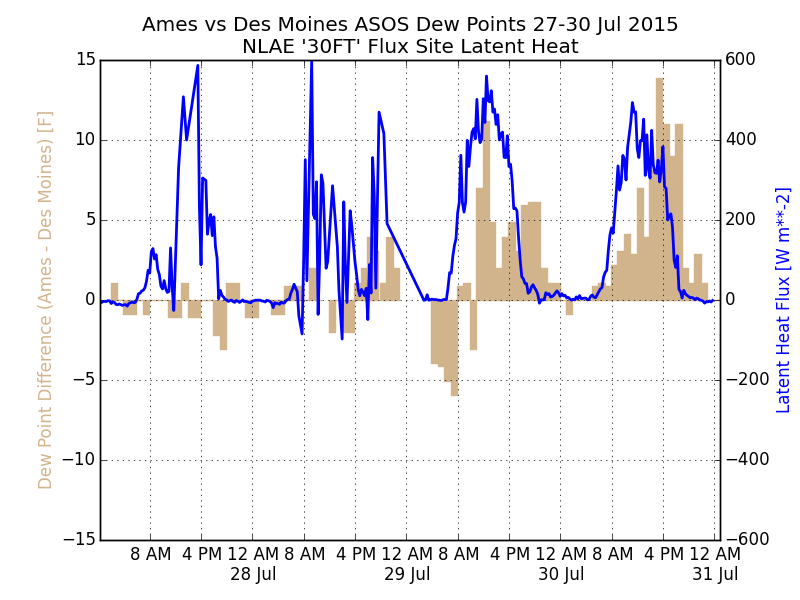
Dew Point Mystery
31 Jul 2015 05:47 AMThe past two days have seen very large differences in dew point develop during the afternoon hours between the Ames and Des Moines airport weather stations. The tan bars on the featured chart show Ames 10+ degrees higher than Des Moines for each of the past two days, but not for the two days prior What could be happening to cause this difference? The blue line is calculated latent heat flux from a flux station nearby to Ames. This value is a proxy to evapotranspiration and magnitude of the values indicate significant amounts of surface/ground water were being transpired into the air. So a theory is that the Ames airport station, which is literally surrounded by corn and soybean fields has elevated humidity levels during the day while the Des Moines station was drier without the substancial nearby agricultural fields. Having said that, NWS Des Moines plans to visit the Des Moines weather station today to check the sensor for issues, so it will be interesting to see what they find out!
Voting:
Good: 38
Bad: 17
Abstain: 17
Tags: dewpoint
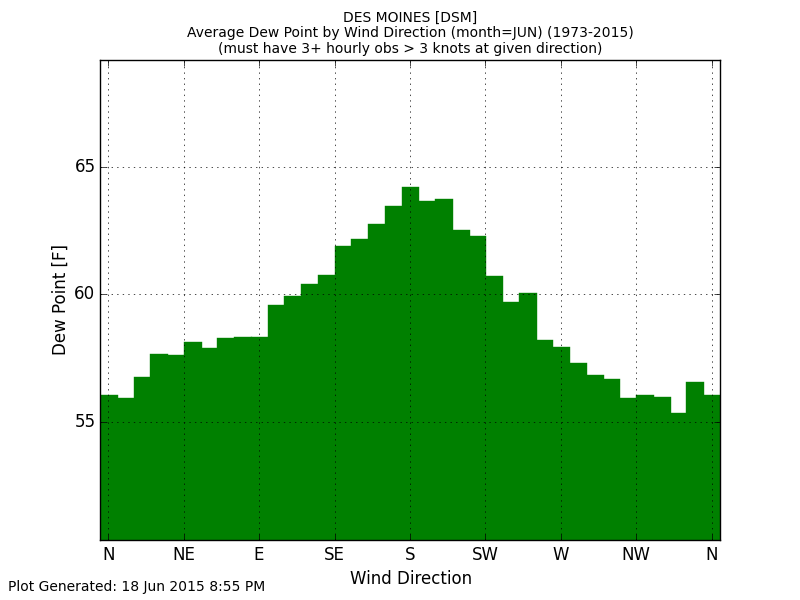
Wind Direction and Dew Point
19 Jun 2015 05:38 AMEarlier this week, the average dew point at a given temperature was featured. Today's feature show the combination of average dew point for a given wind direction. On Thursday, dew points were comfortable with a northerly wind. The featured chart shows a clear relationship between the wind direction and the average dew point for June at Des Moines. Of course, our major source of humidity comes from the south, so it would make sense that our dew points are higher with a southerly wind.
Voting:
Good: 30
Bad: 14
Abstain: 25
Tags: wind dewpoint
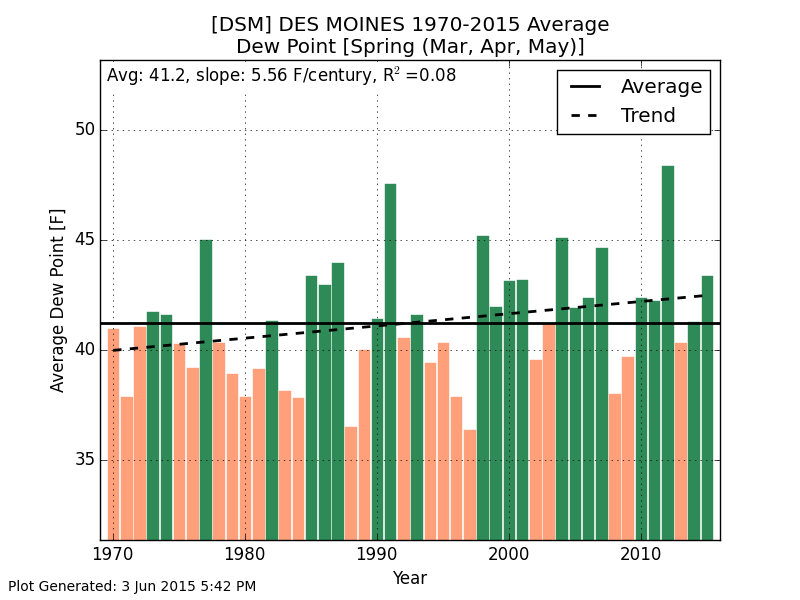
Spring Dew Points
04 Jun 2015 05:42 AMWhile an IEM feature a few weeks back showed that the maximum reported dew point for the year to date was one of the lowest in recent years, the actual average dew point continues the recent trend of above long term average value. The featured chart displays an IEM computed average dew point reading for the Des Moines Airport for the spring season of March, April and May since 1970. The trend line for this period is upward with 13 of the past 18 years above the long term average.
Voting:
Good: 17
Bad: 13
Abstain: 12
Tags: dewpoint
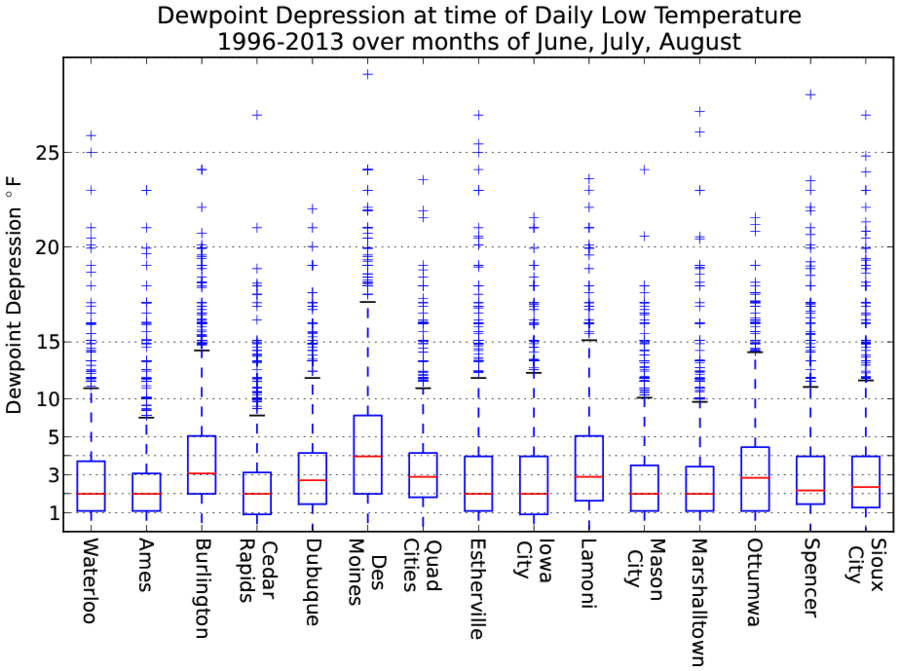
Dewpoint Depression
22 Aug 2013 05:46 AMYesterday's feature looked at the afternoon dew point being an indicator of the next day's low temperature. The theory being that the air temperature would cool off to the dew point temperature and thus be the low temperature. Today's feature looks at the distribution of dewpoint depression at the time of the daily low temperature for each of the ASOS sites in the state. The dewpoint depression is simply the difference between the air and dewpoint temperature. Differences between sites are likely due to micro-climate effects as each ASOS has different surroundings which include soil types, vegetation, and amount of urban area / concrete around it. The chart shows a large difference between Ames and Des Moines with the median dewpoint depression two degrees less at Ames. The first guess explanation for this difference is the larger urban heat island effect at Des Moines, which would tend to keep the temperature higher and further away from the dewpoint than surrounding locations. Also, the Ames ASOS is located in a topographic depression which would promote cooler temperatures.
Additional plots: same plot for high temperatures, Ames weekly dewpoint depression, and weekly for Des Moines.
Voting:
Good: 123
Bad: 12
Tags: dewpoint asos heatisland
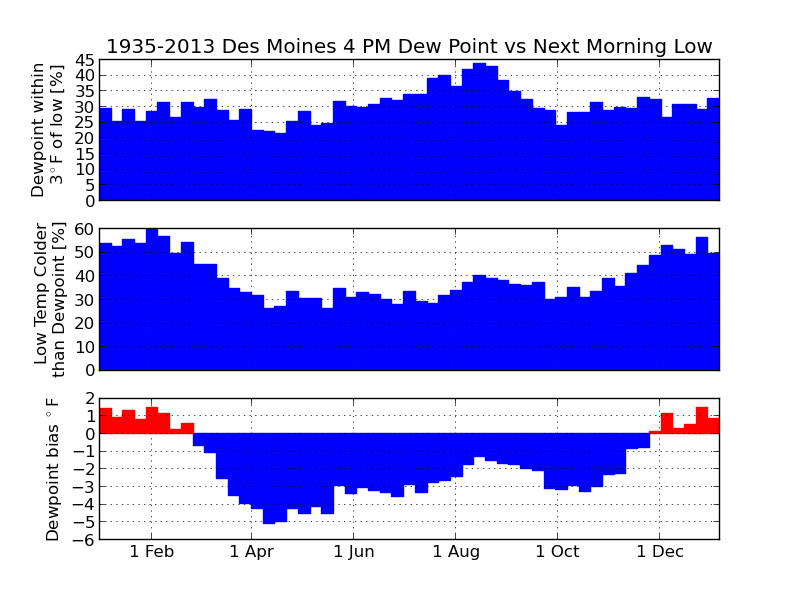
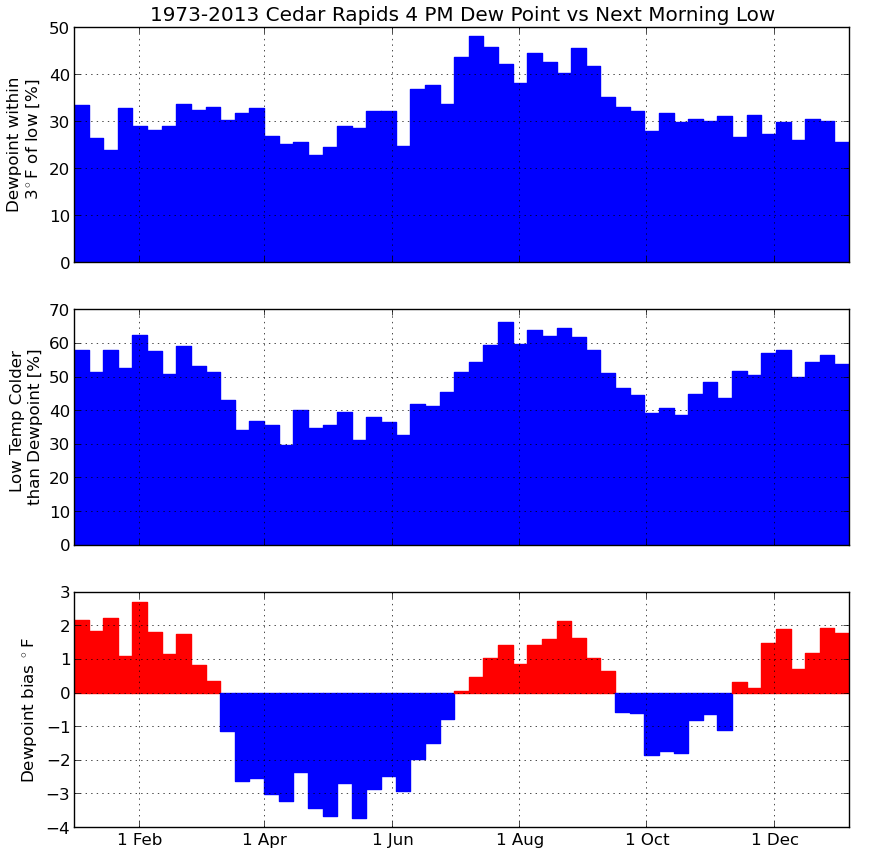
Dewpoint and morning low
21 Aug 2013 05:48 AMWarmer and muggier weather is back in Iowa with dewpoint temperatures in the upper 60s and lower 70s. The increase in moisture means we are done with the overnight lows in the 50s as the dewpoint puts a floor in on how low the temperature can drop. The reason being that once the air reaches saturation, fog will form and temperatures will be stabilized as long wave radiation is absorbed and heat is released as water vapor condenses. The featured chart looks at the relationship between the 4 PM dewpoint temperature and then the morning low temperature for the next day. The top chart shows the percentage of days the low temperature is within 3 degrees of the 4 PM dewpoint. The middle chart shows the frequency of the low temperature being colder than the 4 PM dewpoint. The bottom chart shows the overall bias of the dewpoint and the next day low temperature. The reasons that this relationship does not always work include: winds can create mixing that prevents temperatures from cooling to the dewpoint, clouds prevent heat from escaping, and/or advection processes can transport more humid or drier air masses changing the dew point overnight.
Same plot for Ames and Cedar Rapids
Voting:
Good: 104
Bad: 10
Tags: dewpoint forecasting
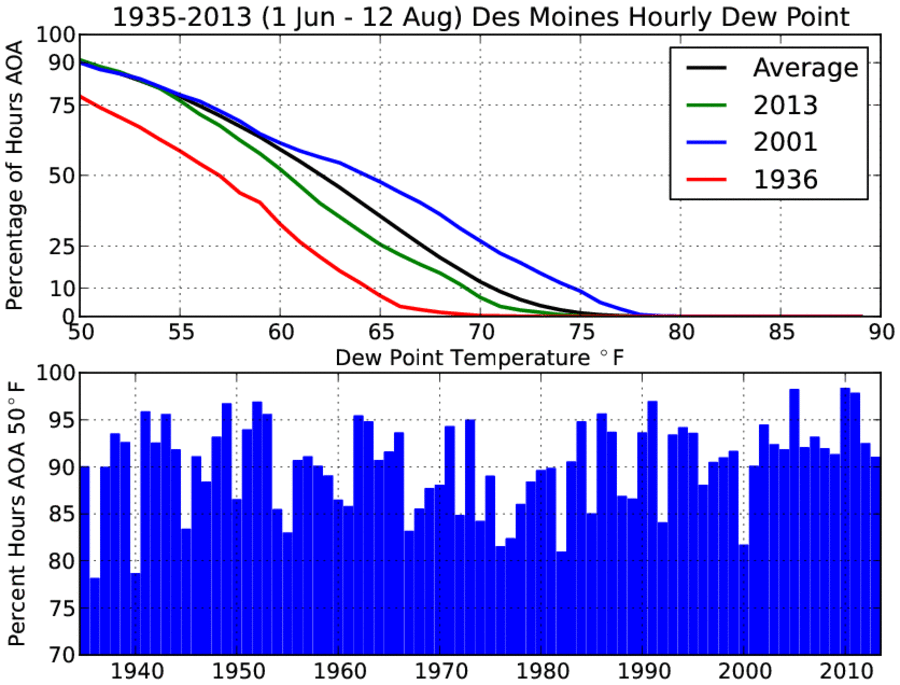
Dew Point Hours
13 Aug 2013 05:42 AMDew Point temperatures are back in the 50s this Tuesday morning allowing the air temperature to cool into the 50s as well. It seems our periods of very muggy weather this summer have been brief. The featured chart presents the percentage of hours since 1 June that the dew point temperature for Des Moines was at or above the given level. A climatological average is shown by the black line and two extreme years are shown as well. Indeed the amount of time at high dew points has been below average this year. The bottom chart shows the percentage of time that the dew point was at or above 50 degrees. Since 2001, each year has been greater than 90%.
Voting:
Good: 60
Bad: 6
Tags: dewpoint
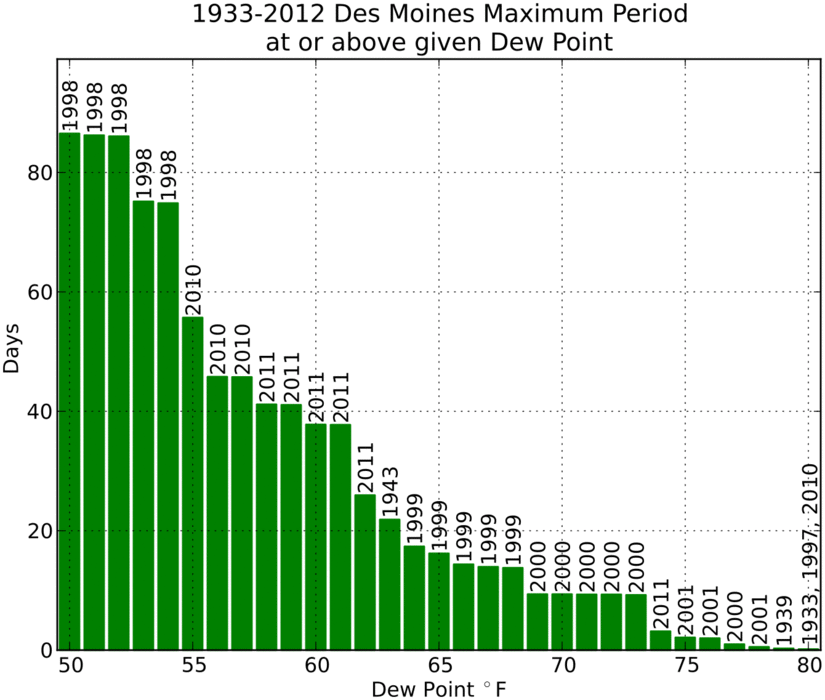
Dew Point Streaks
28 Jun 2013 05:46 AMOur recent bout with muggy weather looks to be taking a respite in the coming days. The featured chart presents the longest periods of having a dew point at or above the given temperature based on hourly observations from Des Moines. For example, back in 2011 the dew point was above 65 degrees for nearly 40 days straight. The upcoming drop in dew point will help limit heavy rainfall events as we really need to dry out in the state.
Voting:
Good: 114
Bad: 11
Tags: dewpoint
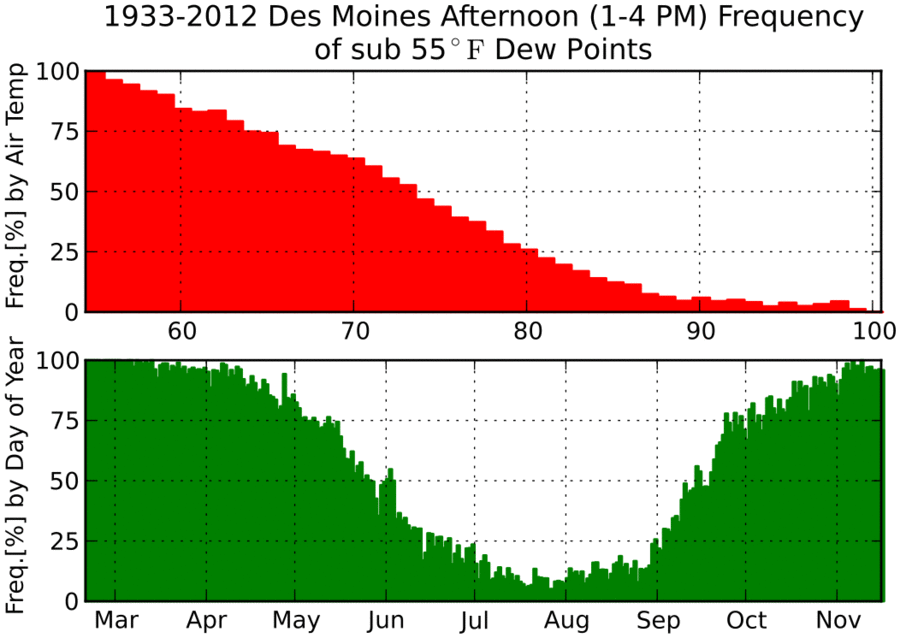
90 and not too humid
18 Jun 2013 05:31 AMSkies were mostly clear on Monday allowing mid June sunshine to nicely warm us into the 80s and even 90s. Humidity levels were very comfortable with afternoon dew points in the 50s. Des Moines reported a 90 degree temperature along with a dew point in the lower 50s. The featured chart presents the frequency of a given afternoon temperature having a sub 55 degree dew point in the top chart and the daily frequency of such dew points overall. The 90 degree temperatures comes with about 10% probably, so our weather yesterday was certainly not the norm. The humidity is scheduled to return later in the week with heat indices near 100 degrees.
Voting:
Good: 65
Bad: 6
Tags: dewpoint

Comfortable Dew Points
24 May 2013 05:40 AMThursday was a very pleasant day in Iowa with high temperatures near 70 and dew points in the 40s. The featured chart presents the frequency of having a sub 50 degree dew point during the afternoon hours for Des Moines. The top chart is the frequency at a given air temperature, so roughly 50% of the time when the air temperature is 70 degrees in the afternoon, the dew point temperature is below 50. The bottom chart shows the frequency by day of the year. The summer months are certainly the most humid and a sub 50 degree temperature is rare.
Voting:
Good: 116
Bad: 13
Tags: dewpoint
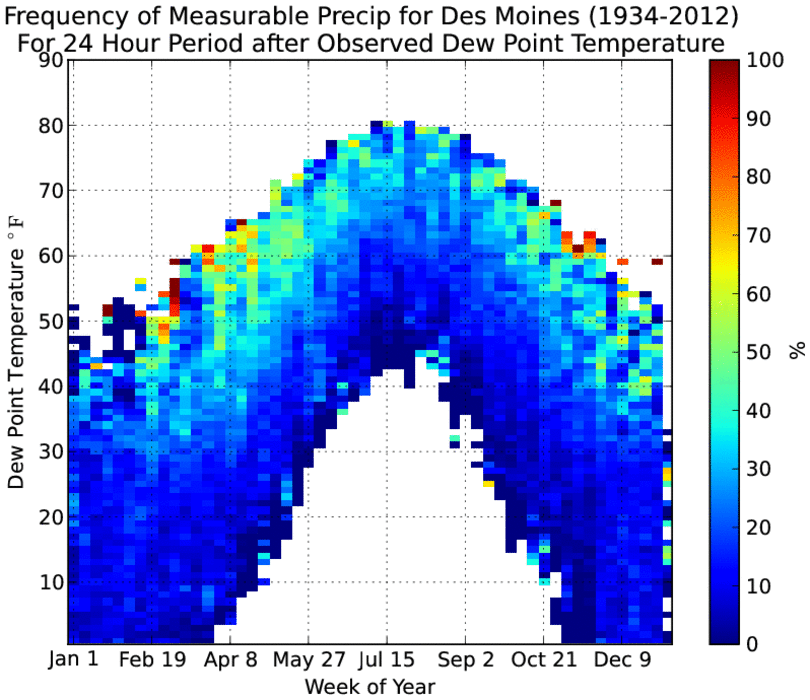
Dew Points then Precipitation
25 Oct 2012 05:00 AMThe very muggy air that has visited Iowa for the past fews days is almost swept clean from the state with the passage of a strong front this morning. It took a bit for showers and thunderstorms to get going Wednesday evening, but the rains did come after sunset. The featured chart looks at the frequency of getting measurable precip for a 24 hour period after a given dew point observation by week of the year. The general pattern is with increased dew points for a given week, the chances of precip increase as well. The highest frequencies are for the spring and fall periods at relatively high dew points for that time of year. These higher dew points are often associated with storm systems that draw moist air from the gulf region northwarn and eventually lead to precipitation, like what is happening today.
Voting:
Good: 27
Bad: 3
Tags: precip dewpoint climate
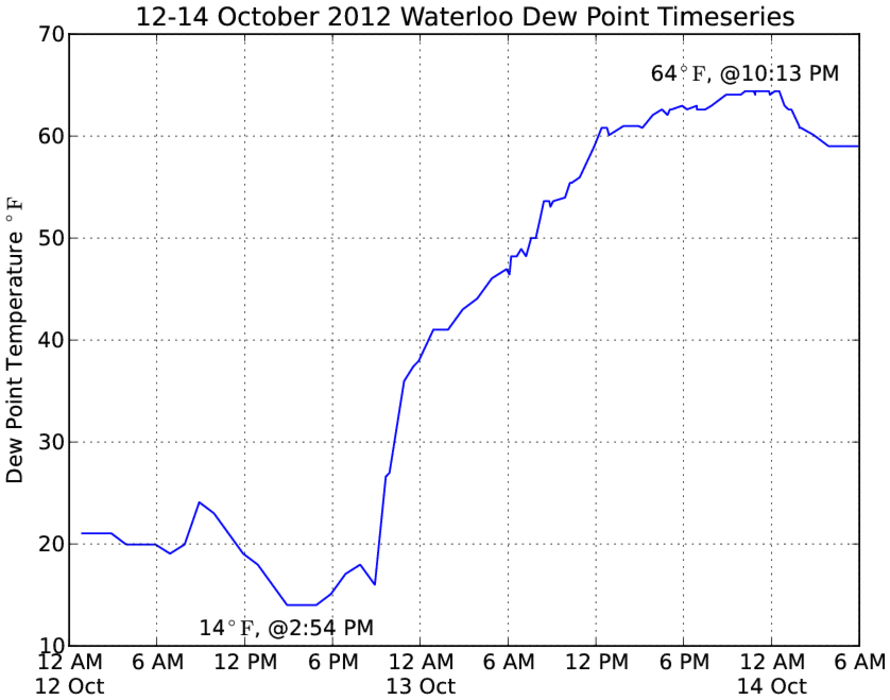
50 degree dew point rise
16 Oct 2012 05:42 AMThis past weekend experienced Iowa's heaviest rainfall since April of this year. This was thanks to an increase in moisture and efficient rainfall producers. The dew point temperature rose significantly into the weekend from 14 degrees on Friday morning to 64 by Saturday evening for Waterloo, which makes for a 50 degree jump in just under two days. Checking back on the archives of data for Waterloo, the largest two day change in dew point on record occurred on 17-19 January 1996 when the dew point went from 50 down to -21 degrees (71 degrees). When just considering rises in dew point over two days, 56 degrees was the maximum back on 1-3 July 1949.
Voting:
Good: 14
Bad: 1
Tags: dewpoint
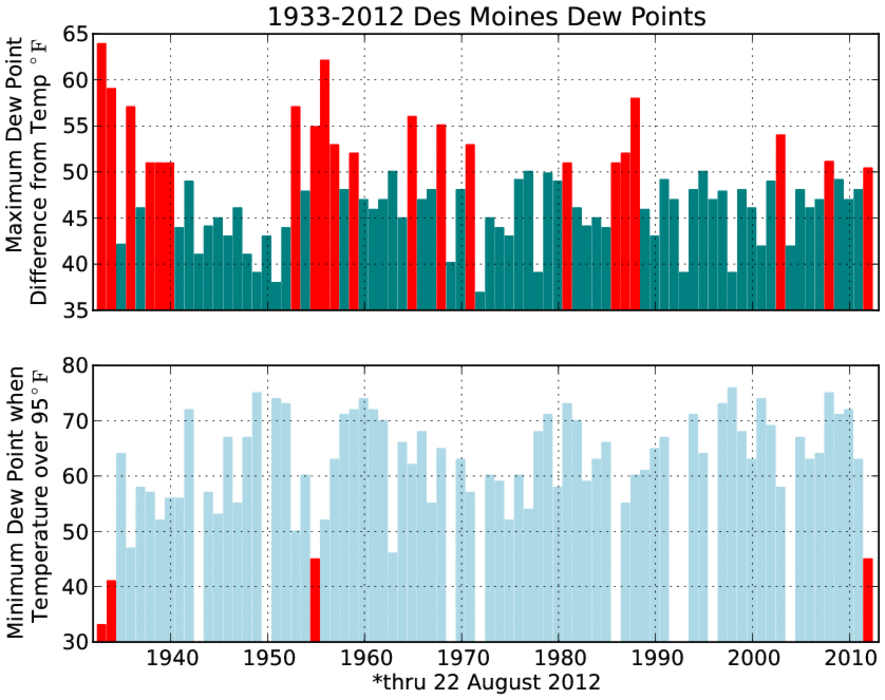
Dew Point Depression
23 Aug 2012 03:31 AMThe difference in dew point temperature from the air temperature is called the dew point depression. On Wednesday, the dew point depressions in Iowa were over 50 degrees Fahrenheit for some locations with a air temperature in the 90s and dew point in the 40s. For Iowa, this is a very rare event! The featured chart presents the largest dew point depression by year and the minimum dew point observed with an air temperature at or above 95 for Des Moines. The bottom chart shows that having such a low dew point and high temperature is very rare and last happened in 1955 (red bars). The upper chart shows that having a 50+ degree spread has happened in a number of past years, but for August it last happened in 1936 (not shown)!
Voting:
Good: 21
Bad: 7
Tags: 2012 dewpoint
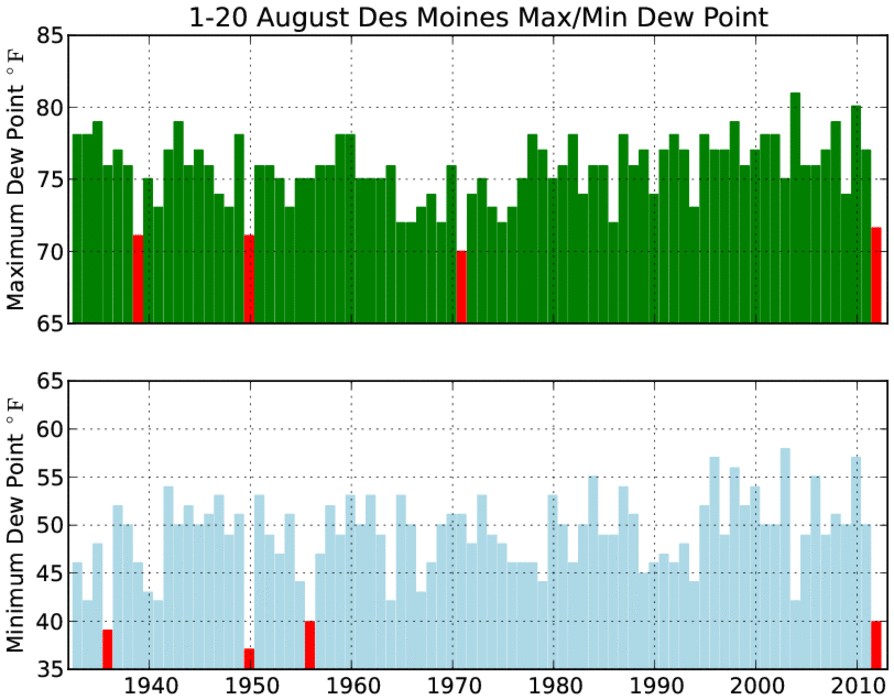
Low dew points for August
21 Aug 2012 12:06 AMThe mostly dry conditions and lack of robust vegetation have lead to very dry conditions for this time of year. Dew points have accordingly been running very low this month. The featured chart presents the maximum and minimum dew point for the first 19 days of August for each of the past years since 1933 for Des Moines. Both values this year are some of the lowest on record and the lowest they have been in quite some time. The red bars are years at or lower than 2012. In order for the first freeze to occur, the dew point has to drop to freezing temperature as well. Could the low dew points be a harbinger of things to come, namely an early freeze?
Voting:
Good: 50
Bad: 11
Tags: 2012 dewpoint aug
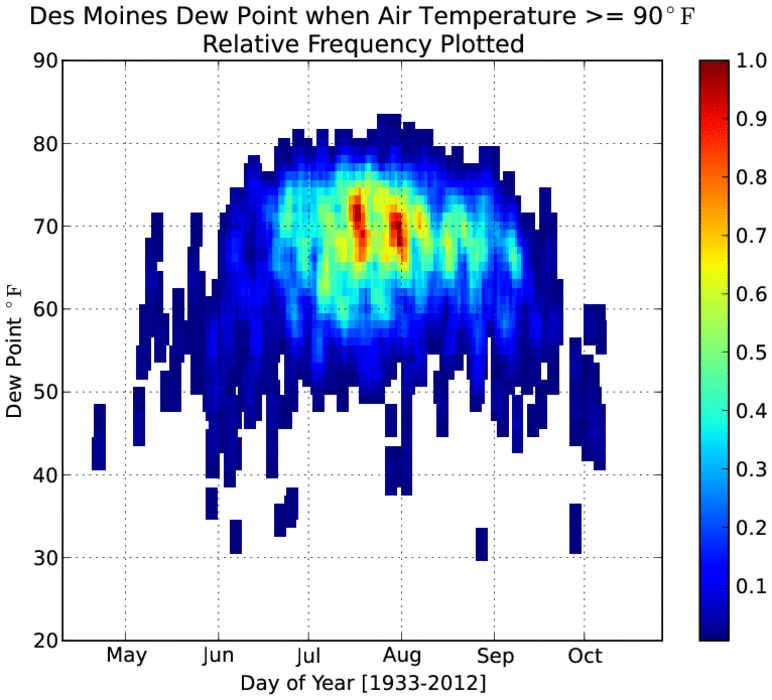
90+ degree temps and dew points
16 May 2012 05:44 AMTemperatures warmed very nicely on Tuesday with Des Moines tieing their record high for the date of 91 degrees. The heat was accompanied by rather dry air as dew point temperatures were well below 50 degrees. The featured chart presents the dew point temperature by day of the year when an air temperature at or above 90 degrees was observed by the Des Moines weather sensor. Typically, hot weather in Iowa is accompanied by muggy conditions with dew point values well above 60 degrees.
Voting:
Good: 33
Bad: 11
Tags: 90 dewpoint
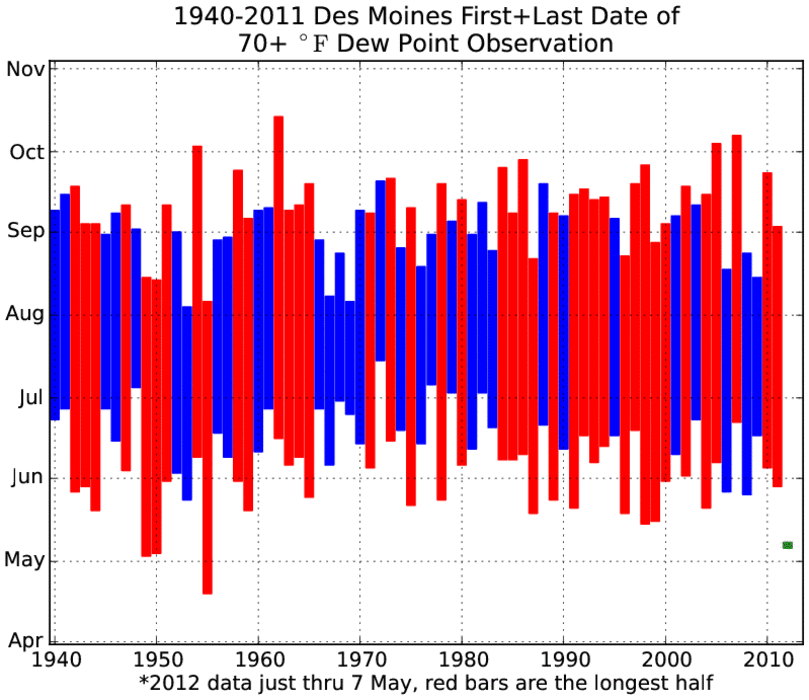
Early for 70 degree dew points
08 May 2012 05:51 AMWarm and moist air surged into Iowa this past Saturday pushing dew point readings over 70 degrees Fahrenheit for Des Moines. The featured chart presents the period between the first and last 70 degree dew point each year. Saturday was only the 5th of May making for the earliest 70 degree reading since 1955!
Voting:
Good: 39
Bad: 5
Tags: dewpoint 2012
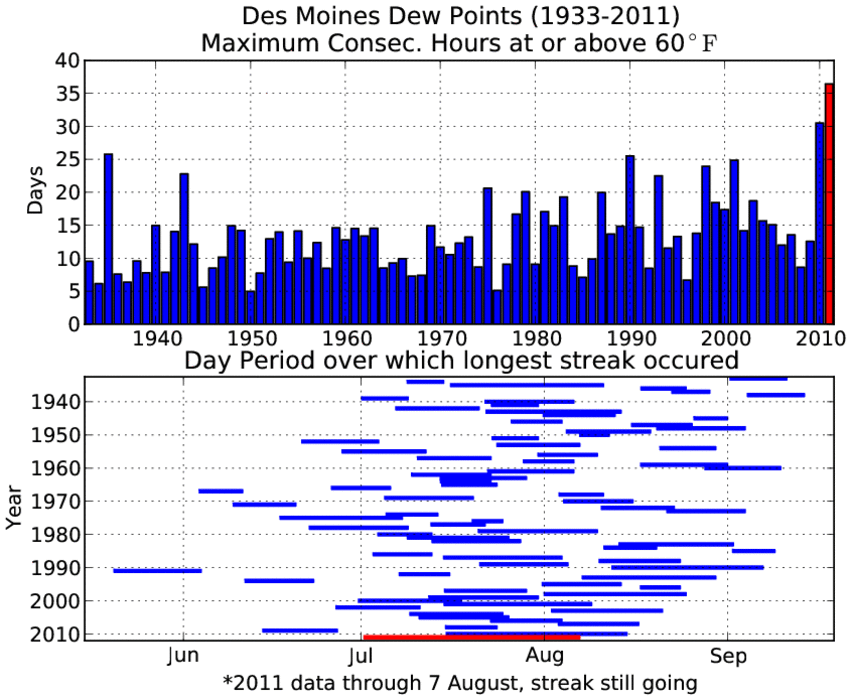
Long stretch of muggy
07 Aug 2011 07:21 PMThe recent few days have been refreshing after a stretch of brutally high dew points. Dew point temperatures for Des Moines have yet to decline below 60 since the 3rd of July. This makes for the longest period above 60 for Des Moines since the early 1930s. The featured plot presents the yearly maximum streak of having dew point temperatures above 60 and the time period over which the streak occurred. The plot nicely shows most of these streaks happening over July and August. With August only a week old, there is plenty of time to increase our streak this year.
Voting:
Good: 21
Bad: 5
Tags: dewpoint 2011

Humid Periods
02 Aug 2011 05:57 AMDew point temperatures once again soared into the upper 70s and lower 80s on Monday. These temperatures were remarkable for the calendar now being in August! The featured chart presents IEM calculated yearly maximum period where the dew point remains above 75 degrees and the total number of hours above 75 degrees. This year is still behind last year by those metrics, but there is still plenty of time to go in August to catch up. While not shown on the chart, many of these humid periods occurred during August.
Voting:
Good: 17
Bad: 3
Tags: dewpoint 2011
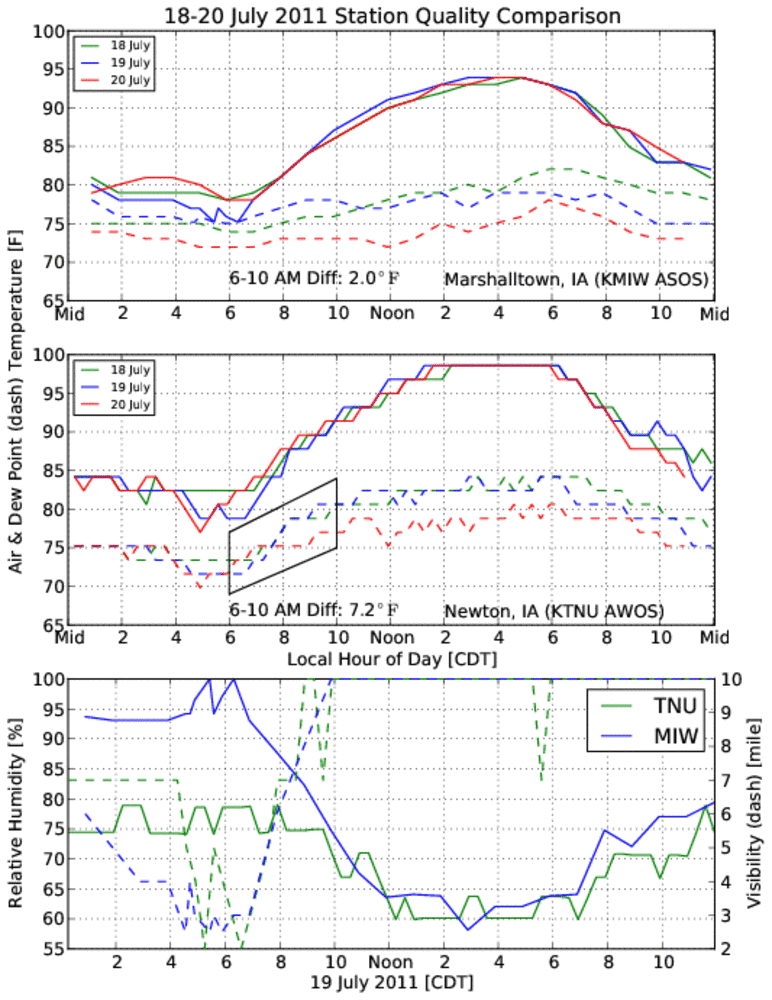
Unreliable Dew Points
21 Jul 2011 12:33 AMOur recent stretch of extremely hot and muggy weather has gotten Iowa a bit of publicity as some of our automated stations have calculated heat indexes that exceeded 130 degrees! Typically, this is blamed on the abundant transpiring corn crop in the state, but that is not the entire story. The primary source of automated weather data in the state are located at airports, but there are two classes of instruments. The federally administered ASOS sites have higher quality and sometimes different sensors than their state run AWOS counterparts. Unfortunately, their data is typically thrown together in the same pot and reported as such. While the ASOS sites did indicate gaudy heat indexes exceeding 110 at times, they were not as high as the AWOS sites which got all the headlines. The featured chart presents a comparison of an ASOS and AWOS site separated by 30 some miles and both surrounded by farm fields. The bottom plot raises the most doubt as even while visibilities were at 2-4 miles, relative humidity was just 75% at the AWOS site and near 100% at the ASOS site. This is probably an indication that the AWOS air temperature has a warm bias. The second plot shows another issue of having the AWOS dew point rise dramatically during the morning hours at a much higher rate than the ASOS site. It is hard to imagine a natural process that could be putting that much water into the atmosphere in the early morning hours. The first plot of the ASOS site shows a reasonable depiction of transpiring corn (slowly rising dew point throughout the day peaking late afternoon coinciding with plant transpiration), but the dew point temperature barely gets to 80 degrees which keeps the calculated heat index at reasonable values. The moral of the story is that not all automated sensors are alike and while heat indexes over 110 surely were felt in Iowa these past days, the high end values over 120 are questionable.
Voting:
Good: 54
Bad: 5
Tags: awos heatindex dewpoint
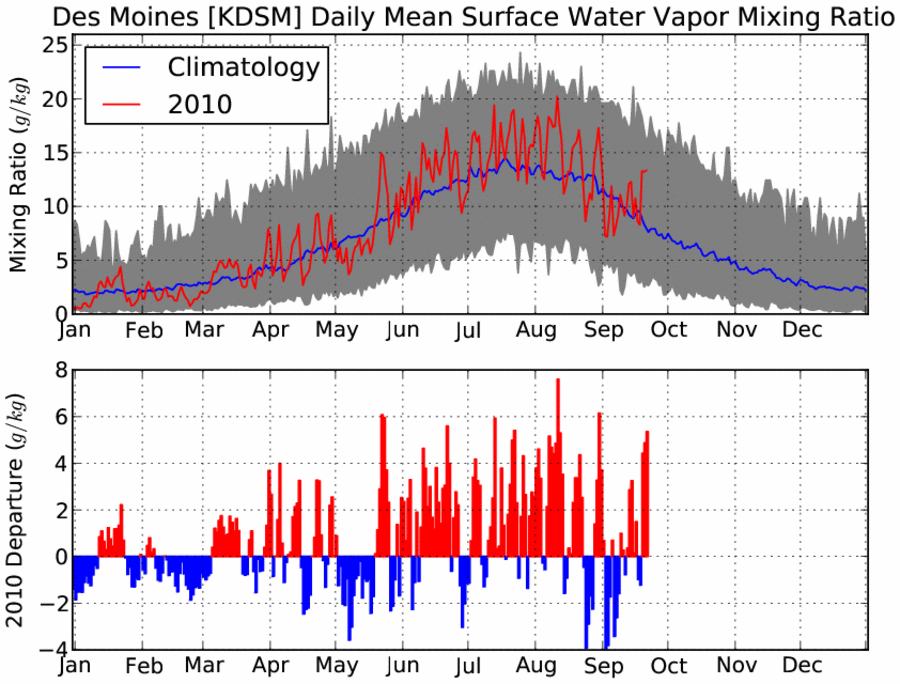
Above average humidity returns again
23 Sep 2010 05:02 AMA push of warm and moist air has once again invaded the state making today feel more like summer than fall. The featured chart presents the climatology of near surface water vapor mixing ratio, which is a measure of the amount of moisture held in the atmosphere. The summer of 2010 has certainly seen more than its fair share of humidity as noted by the dominance of red in the lower plot. The grey filled area in the top plot represents the range of mixing ratio. It is interesting to see that the lowest values in the summer are still higher than the maxes in the winter.
Voting:
Good: 25
Bad: 8
Tags: dewpoint 2010 climate

Will 70+ dew points return?
06 Sep 2010 08:07 AMThe featured chart presents the number of cycles per year that the dew point observed at Des Moines goes from a value above 70 to below 50 and then back to 70+ after 1 August. For 2010, we have already experienced one such cycle and have an outside chance of completing another today with a storm system drawing warm and moist air north. The chart would indicate that returning back to the 70s after our second dip into the sub 50s would not be uncommon. The maximum value shown of 5 cycles was in 1997.
Voting:
Good: 23
Bad: 5
Tags: dewpoint
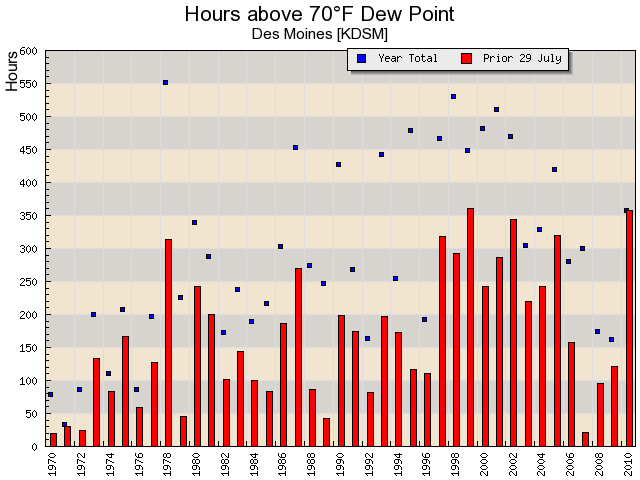
Muggy Hours
29 Jul 2010 06:47 AMThe featured chart presents the IEM computed number of hours per year that the Des Moines Airport ASOS reports a dew point at or above 70 degrees F. The year to date total for this year is the second largest since 1970 and already larger than the full year totals for the past four years. Thankfully our dew points today will be well below 70 making for a nice summer day. Humidities will be on the rise for next week along with thunderstorm chances.
Voting:
Good: 30
Bad: 7
Tags: dewpoint

Extreme Dewpoints
16 Jul 2010 05:13 AMThe featured map displays maximum observed dewpoints on this past Wednesday. Observation sites in both the ASOS and AWOS networks reported dewpoints in the lower 80s, which is a rare event. Dewpoint values just in the lower 70s are considered dangerous! A front was able to sweep the state clean of this obscene air for now, but there is plenty of time in summer left for it to return.
Voting:
Good: 72
Bad: 12
Tags: dewpoint 2010
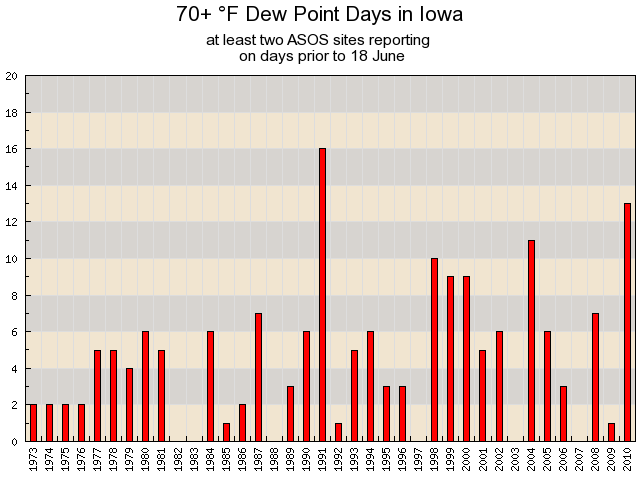
Uncomfortable Days
18 Jun 2010 06:08 AMHeat and humidity returned to Iowa on Thursday with most of the state experiencing dew point temperatures in the lower 70s. The featured chart presents the number of days per year that at least two ASOS sites in the state report a 70+ dew point on the same day prior to 18 June. This year has already seen 13 days, which is the second highest total since 1973. Another uncomfortable day is in store for today.
Voting:
Good: 46
Bad: 153
Tags: dewpoint 2010

Dew Points and Severe Weather
05 Apr 2010 05:09 AMThe featured chart presents a quick analysis of near storm environment for the archive of NWS issued Tornado and Severe Thunderstorm warnings back to 1986 by month. The box and whisker plots help to visualize the range of values common during the issuance of the warning. In general, dew points are a bit higher for tornado warnings, which is expected as higher dew points indicate more energetic environments and perhaps higher relative humidities (lower cloud heights). For April, once the dew points reach the 50s severe weather appears to be more possible. Some severe weather occurred on Sunday over far southeast Iowa, where surface moisture was available (dew points much higher than the rest of the state). Higher dew points are expected to make their way north today with a warm front and our chances of severe weather will as well.
Voting:
Good: 18
Bad: 12
Tags: climate nws dewpoint
Summertime Dew Points
02 Jul 2009 06:15 AMOur recent stretch of weather has seen very comfortable dew point temperatures in the 60s. The featured graph is a climatology of dew point observations from the Des Moines Airport. The five lines shown represent the lower (0) and upper bound (100) of 1 PM observed dew points along with the 25th and 75th percentile and also the median value (50). The months of July and August are highlighted for their rather consistent daily values due in part to increased plant transpiration.
Voting:
Good: 22
Bad: 18
Tags: dewpoint

Obscene Dew Points
24 Jun 2009 06:17 AMDew point temperatures on Tuesday reached the upper 70s and lower 80s, which makes the air extremely uncomfortable to deal with. A powerful thunderstorm complex, fueled by this massive amount of moisture in the air, brought relief mid afternoon. Dew points and temperatures will be on the rise again today with another round of thunderstorms eventually cooling most of the state off.
Voting:
Good: 22
Bad: 7
Tags: dewpoint
When does the max dewpoint occur?
19 Nov 2008 06:09 AMContinuing with the series of climate features, today a plot of when the highest dew point temperature for the local day occurs. First off, let us start by saying that dew points are much less diurnal in nature than air temperature and outside of sensor bias, dew point is not a function of air temperature. The featured plot shows two obvious extremes around midnight, this is due to air mass advection bringing in more or less moist air during most of the 24 hour period (excuse brevity of explanation please). The plot also shows maxima:
- in the mid morning during the growing season due to dew evaporation before drier air is mixed down due to boundary layer growth,
- the early evening in the late summer probably due to increased corn/soy plant evapotranspiration and thunderstorm/frontal activity,
- and mid afternoon in the winter perhaps due to evaporation(?).
As with the other features, let me know what you think and how you
think this is explained incorrectly. :)
Voting:
Good: 26
Bad: 6
Tags: climate dewpoint
Muggy weather still possible
13 Aug 2008 06:50 AMThe featured chart is a histogram of the percentage of years that a 75+ degree dew point was observed per day since 1973. The frequency is roughly 1 in every 5 years during the summer with July having the most days.
Voting:
Good: 17
Bad: 11
Tags: summer dewpoint