Past IEM Features tagged: awos

Bad 90 Degree Dew Points
22 Aug 2023 05:33 AMIn the why we can't have nice things department, the weather world was abuzz yesterday about a number of airport weather stations in Iowa that reported upper 80s and even low 90 degree dew point temperatures. Sadly, the reporting mechanisms lump most of the airport data into one data stream that mixes federally maintained (FAA/NWS) ASOS airport weather stations in with the state maintained (Iowa DOT) AWOS stations. Folks rightly assume that all airport data is created equal, but it is not. Unfortunately, siting, maintenance, sensor packages, and aspiration differences can yield big differences in reported weather variables. The featured chart compares a temperature and dew point time series for three sites in the state. The Denison AWOS (lower panel) was one of the aforementioned sites that hit 90+ for a dew point and the immediate hand-waving explanation for the data being valid is "corn sweat". The other two sites were chosen as sites also in close proximity to agricultural fields, but yielded a different depiction of peak afternoon dew points. Two important times of the day are highlighted to point out physical processes happening. To start off the morning hours, we are at 100% humidity with likely lots of dew and even some fog. The sun rises and heating of the ground and plants ensue, this produces a demand from the air for water that may be available and also the plant is wishing to start transpiring with its activity, dew is also being evaporated. So the temp and dew point separate a bit, but both are rising. By the afternoon, only transpiration is usually left and temperatures are quite warm with good mixing of the lower atmosphere, it is difficult to increase humidity levels during this time. By early evening (blue area), mixing decreases and humidity levels can make one subtle push higher before stabilization happens and air temperature and dew point starts to both slowly work downward. Having 100% relative humidity like Denison does throughout the day is a tell-tale sign of a sensor problem and not depicting what is happening in/near agricultural fields in the state. Yes, "corn sweat" (and soybeans too) contributes a number of degrees to the dew point temperature this time of year, but is not able to push it much higher than the lower 80s. As temperatures warm into the 90s and absolute humidity increases, plants will cut back to conserve water and dew points can't simply keep increasing with the temperature.
Voting:
Good: 26
Bad: 2
Tags: awos
Unreliable Dew Points
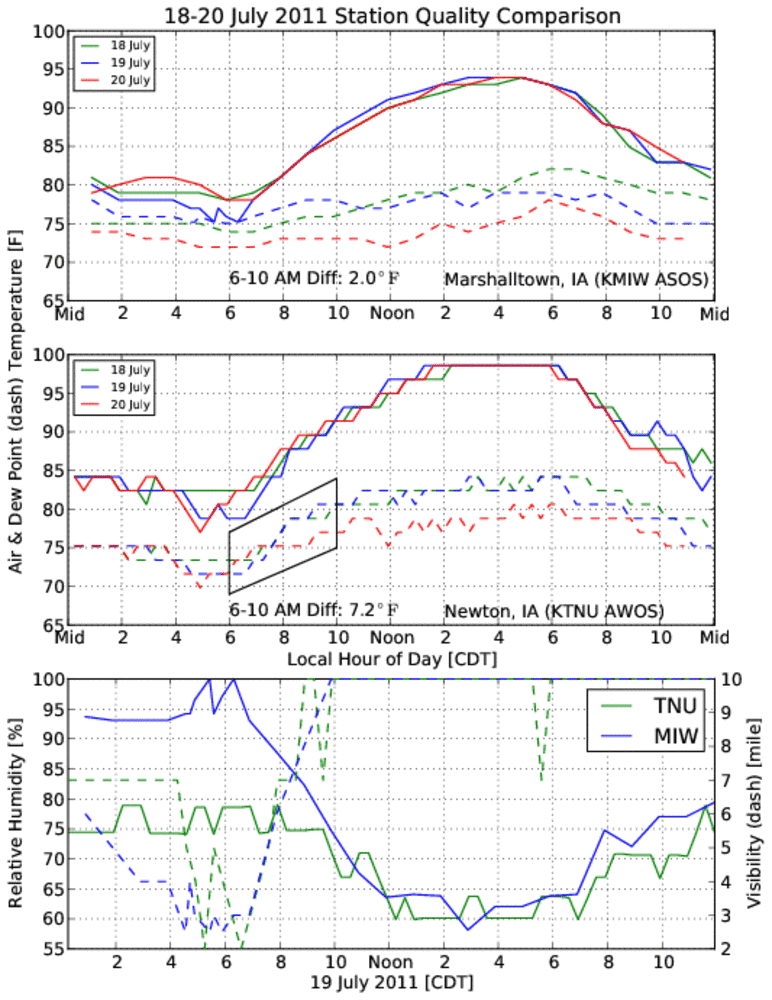
21 Jul 2011 12:33 AMOur recent stretch of extremely hot and muggy weather has gotten Iowa a bit of publicity as some of our automated stations have calculated heat indexes that exceeded 130 degrees! Typically, this is blamed on the abundant transpiring corn crop in the state, but that is not the entire story. The primary source of automated weather data in the state are located at airports, but there are two classes of instruments. The federally administered ASOS sites have higher quality and sometimes different sensors than their state run AWOS counterparts. Unfortunately, their data is typically thrown together in the same pot and reported as such. While the ASOS sites did indicate gaudy heat indexes exceeding 110 at times, they were not as high as the AWOS sites which got all the headlines. The featured chart presents a comparison of an ASOS and AWOS site separated by 30 some miles and both surrounded by farm fields. The bottom plot raises the most doubt as even while visibilities were at 2-4 miles, relative humidity was just 75% at the AWOS site and near 100% at the ASOS site. This is probably an indication that the AWOS air temperature has a warm bias. The second plot shows another issue of having the AWOS dew point rise dramatically during the morning hours at a much higher rate than the ASOS site. It is hard to imagine a natural process that could be putting that much water into the atmosphere in the early morning hours. The first plot of the ASOS site shows a reasonable depiction of transpiring corn (slowly rising dew point throughout the day peaking late afternoon coinciding with plant transpiration), but the dew point temperature barely gets to 80 degrees which keeps the calculated heat index at reasonable values. The moral of the story is that not all automated sensors are alike and while heat indexes over 110 surely were felt in Iowa these past days, the high end values over 120 are questionable.
Voting:
Good: 54
Bad: 5
Tags: awos heatindex dewpoint
Not Physical
08 Jun 2004 08:47 AMThis plot shows temperature and dew point traces from Mount Pleasant (MPZ) and Ottumwa (OTM) Monday morning. The MPZ plot depicts an early morning scenario that is hard to believe. It is nearly impossible to have 100% humidity while the temperature warms 9 degrees in the early morning from solar insolation. If it was truely that humid in the lower boundary layer, the sun would have had a tough time mixing down the moisture quick enough to maintain saturation with an increasing air temperature. This is not physical and indicates bad data.
Tags: awos