Past IEM Features tagged: arridity

Arridity Index Timescales
13 May 2021 05:34 AMThe Arridity Index is a handy means to combine the effects of temperature and precipitation departures. While it has been dry here lately, temperatures have been cool which helps to lessen water demand by the atmosphere and nascent plants. The index is computed by taking the standardized high temperature departure and subtracting the standardized precipitation departure, both of which are measured in sigma units. Positive values generally imply water stress and negative imply less water stress. The featured chart presents the index for Ames computed over three different trailing day periods since the beginning of last year. It is interesting to note that very little time over the past 365 days has been spent with any of these three metrics in negative territory. Our continued saving grace thus far this growing season has been the cool conditions. While rain is in the forecast, the heaviest amounts will stay off to our south and temperatures continue to look to plod along at seasonally cool levels.
Voting:
Good: 6
Bad: 0
Tags: arridity

Arridity Concerns
08 Jun 2020 04:26 AMAfter being so wet last year and with a recently typical wet spring season expected this year, it was hard to imagine that we'd have concerns about dryness over the state for early June. The featured chart presents a metric called arridity, which is an index that combines standardized temperature and precipitation departures. The index is evaluated each day over the given number of trailing days and is plotted for Sioux City. The long term (365 day) value continues to creep higher and is about to cross zero for the first time since early 2018. Some significant rains are forecast this week, so it will be interesting to see how wide spread those are over the state to erase some recent dryness.
Voting:
Good: 10
Bad: 0
Tags: arridity

30, 60, and 90 Day Arridity
19 Jul 2017 05:32 AMSome of the driest conditions in the state currently can be found over southeastern Iowa. The featured chart looks at the arridity index calculated over 30, 60, and 90 trailing day periods for this year for an areal averaged value representing southeastern Iowa climate district. This index combines temperature and precipitation departures to access water stress. Since early June, the chart shows the increasing stress for this area. There are more chances of rain in the forecast, but the best chances are over northern Iowa.
Voting:
Good: 13
Bad: 0
Tags: arridity
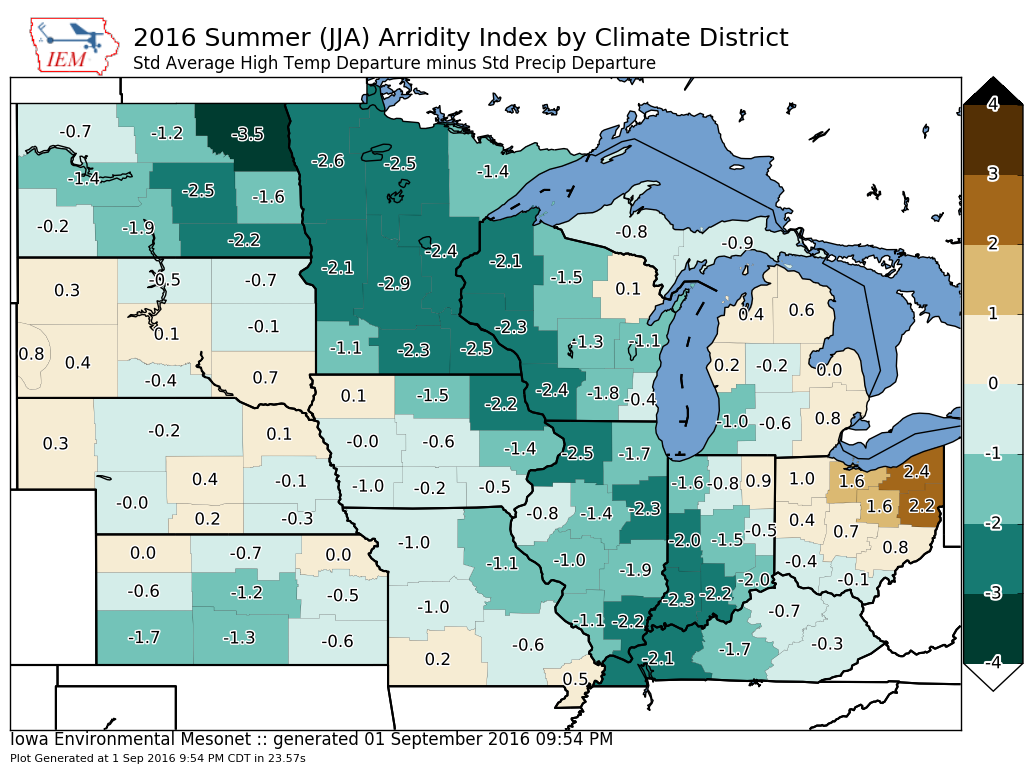
Summer Arridity Index
02 Sep 2016 05:18 AMArridity Index is a combined measure of temperature and precipitation departures. In this context, the normalized temperature departure is subtracted by normalized precipitation departure. The featured map displays this metric computed over the entire summer by climate district. Positive values indicate areas of increased water stress. For the corn belt, a clear gradient is shown with the far eastern areas under the highest water stress with much of the western portion showing much less stress.
Voting:
Good: 10
Bad: 2
Tags: arridity
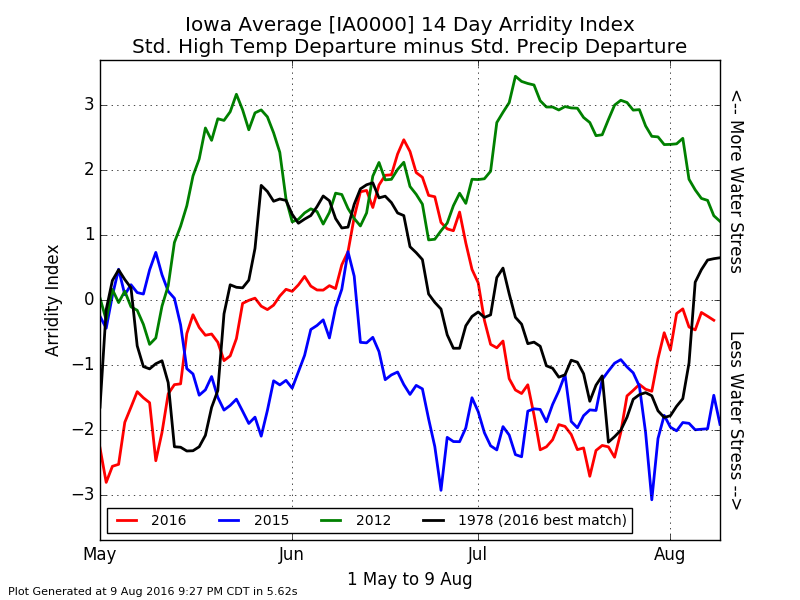
Comparing Arridities
10 Aug 2016 05:29 AMContinuing with the recent theme of featuring IEM Arridity plots, today's featured chart compares fourteen trailing day arridities for statewide averaged temperature and precipitation during the 1 May to 8 August period. This year is shown, along with last year and 2012 (drought year). The plot also dynamically includes the closest match to this year's data based on least RMSE , which is 1978. This year has seen much more stress than last year, but pales in comparison to 2012. You can generate this plot for other locations and periods of your choice.
Voting:
Good: 8
Bad: 1
Abstain: 1
Tags: arridity
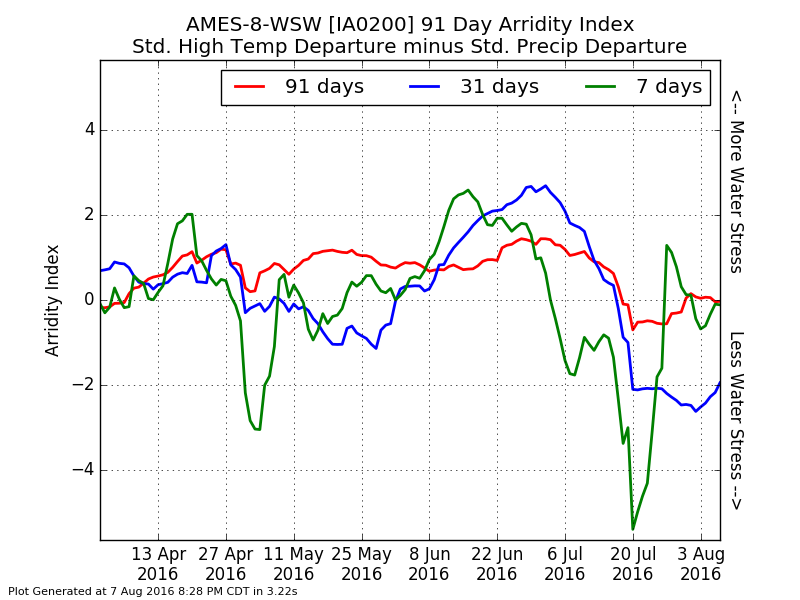
Three Arridities
08 Aug 2016 05:44 AMThe featured chart presents an arridity index evaluated over three different trailing number of days for Ames. The heat and water stress of the first half of the growing season has given way to timely rains and limited periods of very hot weather. This index is computed by taking the standardized departure of average temperature and subtracting the standardized departure of precipitation. You can generate this plot on this website for other locations and for a trailing number of days of your choice.
Voting:
Good: 10
Bad: 0
Abstain: 1
Tags: arridity

Spring Arridity
14 Jun 2016 05:34 AMContinuing on yesterday's featured chart showing a time series of Arridity Index, today's featured map displays the climate district values for the spring months of March, April and May. For Iowa, the eastern two thirds of the state are analyzed at values above zero indicating more water stress than average. You can now generate these maps on this website for a season or month of your choice.
Voting:
Good: 10
Bad: 1
Tags: arridity

Arridity Index
13 Jun 2016 05:34 AMThe featured chart displays a time series of an Arridity Index computed for the central Iowa Climate District. There are a number of ways this index can be computed. For the purposes of this plot, it presents the standardized departure of average daily high temperature subtracted by the standardized departure of total precipitation over the past 31 days. The standardization is simply normalizing the departure by the standard deviation of departures for each of the same periods for the period of record years. The index is an attempt to express the additive effects of having anomalously hot and dry weather at the same time. Having either cool and/or wet weather decreases the index value. Rewording, wet weather can help mitigate warm weather. Anyway, no index is perfect and for central Iowa, this index shows the recent increase in June with the arrival of hot and mostly dry weather. Rain has been visiting the state recently, but just not widespread.
Voting:
Good: 7
Bad: 2
Abstain: 2
Tags: arridity