Past IEM Features tagged: 1988

Accumulated Precipitation
06 Sep 2013 05:44 AMWill 2013 be remembered for being a wet year or a dry year or both? The featured chart displays the statewide accumulated precipitation for this year, last year, 1993 (wettest year), and 1988 (driest year). The shading represents the range of values since 1893. Around the end of June, this year was the wettest to date on record, including 1993. The weather since then has been very dry and how the year to date accumulation is approaching merely average with 1993 some 15 inches higher! The forecast continues to hold little hope of widespread precipitation.
Voting:
Good: 146
Bad: 16
Tags: 2013 2012 1993 1988 precip
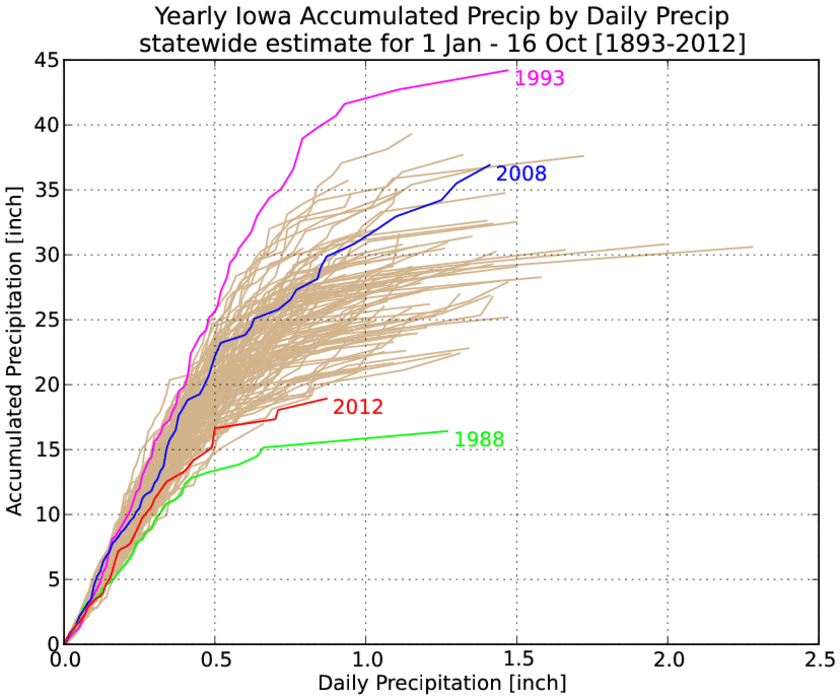
Precipitation accumulation
17 Oct 2012 05:41 AMPrecipitation comes in various forms and at various rates for Iowa. For this year, precipitation has been difficult to come by. Have we missed out on heavy rainfall events or lots of smaller rainfall events? The featured graph attempts to address this question by showing the accumulated precipitation over increasing daily precipitation. For example during 2012, the total rainfall for daily events less than 0.5 inch has been 15 inches. Restating, 15 inches of rainfall this year has come from daily events of less than 0.5 inches. The flood year of 1993 certainly sticks out on the opposite end of the spectrum. So for 2012, the line would indicate we have missed out on both light and heavy rainfall events.
Voting:
Good: 14
Bad: 5
Tags: 2012 1988 1993
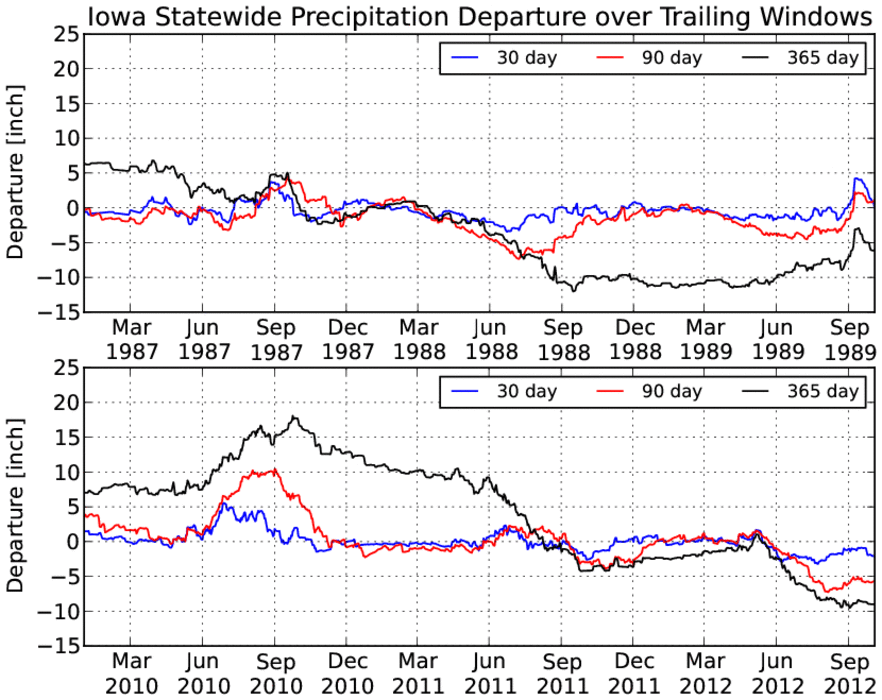
When did the drought start?
05 Oct 2012 05:45 AMIowa remains in the firm grasp of a drought, but when did it start? It is hard to define when a drought starts as the term "drought" is ambiguous and it takes some amount of time of dry weather before the term can apply. The featured chart looks at the running departure of statewide precipitation over three different windows of time for a period around 1988 and our current drought period of 2012. For this year, this analysis would clearly indicate that significant deficits started showing up in May. Although, a closer look shows somewhat drier conditions existing since September of 2011. Let us compare 2012 with 1988 shown in the top chart. Significant deficits started appearing in March of 1988. If the 2012 drought started in May and 1988 in March, this may provide some insight into why agricultural crops were not a complete failure in the state this year. The reason being there was some soil moisture available to start off the growing season and some precipitation came in late August/September to help out. Notice how the 365 day departure degraded in Aug/Sep for 1988 and flattened out for 2012.
Voting:
Good: 43
Bad: 27
Tags: drought 2012 1988
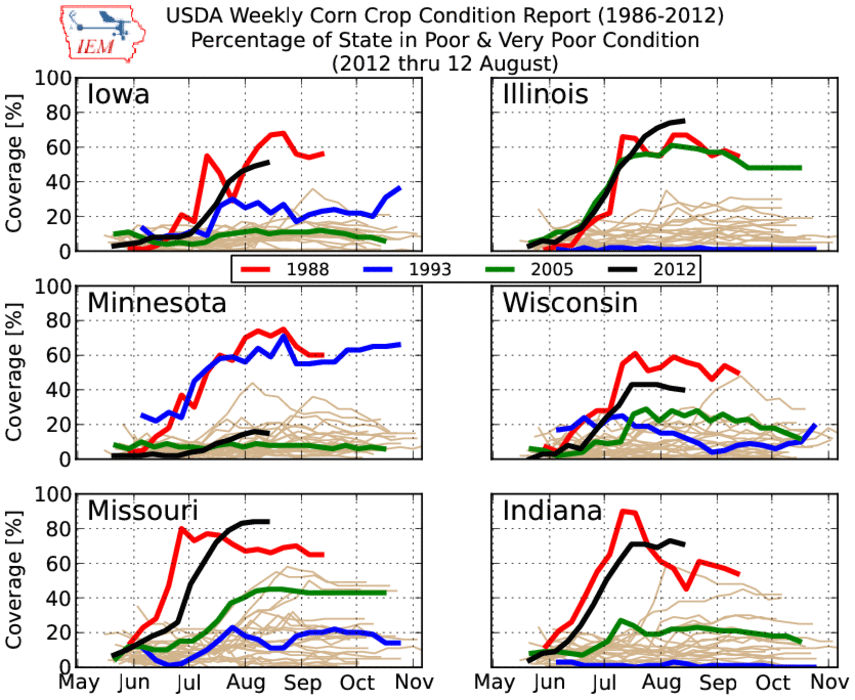
Bad year for corn
17 Aug 2012 05:47 AMThe featured chart presents yearly time series of USDA reported weekly corn crop condition for Iowa and five nearby states. The charted line represents the total area estimated to be in either "poor" or "very poor" condition. These are the two worst categories that are designated. Each chart contains the time series for each year since 1986. Conveniently, this allows us to compare this year with the last major drought of 1988 in the Midwest. Other significant years of 2005 and 1993 are included for comparison. While 2012 has been devastating in Missouri, Illinois, and Indiana, things have not been all that bad in Minnesota. Compare that with what happened in 1993 where Minnesota got the worst of it. It is not for certain how much some recent rains in the Midwest will help the corn crop as the damage has pretty much already been done in the hardest hit areas.
Voting:
Good: 82
Bad: 25
Tags: usda corn 2012 1988 1993

Comparing with 1988
11 Aug 2012 06:14 AMThe drought of 2012 for Iowa will certainly go down as one of the more extreme on record. Since most people can remember the drought of 1988, comparisons continue to be made to that year with many wondering which year was more severe. While there is no correct answer, the featured chart provides two metrics for comparison. The x-axis presents the accumulated, from 10 August back to the given date, precipitation departure for both this year and 1988. For the period since 1 January, 1988 had the least amount of precipitation since 1893. The two lines show that 1988's drought started much earlier in the year than 2012, but the intensity of the drought during the growing season has been slightly worse (for this period) in 2012. The chart also shows you how much precipitation we would need to erase a given deficit over some period. For example, at least ~8 inches are needed in order to erase the deficit since 1 May.
Voting:
Good: 137
Bad: 21
Tags: 2012 1988
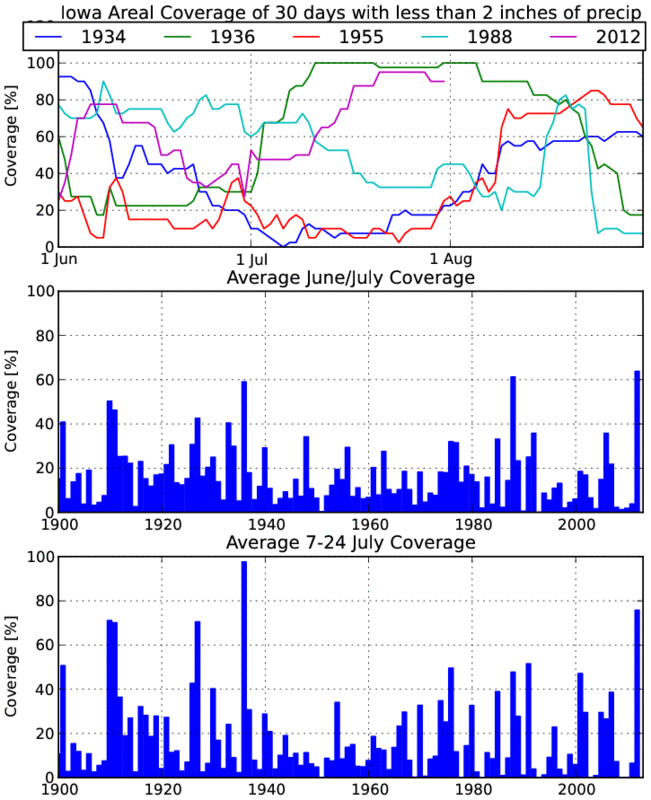
Arbitrary Metrics
31 Jul 2012 05:43 AMThis feature continues the series of comparing how the drought this growing season stacks up with previous years. For this metric, an estimated areal coverage of Iowa is presented that had a previous thirty day period with less than two inches of total rainfall received. This arbitrary metric attempts to show the breadth of dry continues and how it changed over the period. The top chart presents the daily coverage for this year and four previous years of note. In this comparison, 2012 shows up much worse than 1988 in late July, but better in late June. The middle chart presents the simple average of the value over the June and July period and 2012 has the highest value around 60% since the year 1900 followed closely by 1988. The bottom chart looks at this value during a key period for corn development in mid-July. 1936 is easily the largest average coverage as shown by this metric. So the question remains unresolved, how does this year compare with previous drought years? Is it worse than 1988?
Voting:
Good: 53
Bad: 14
Tags: 2012 1955 1934 1936 1988