Past Features
This page lists out the IEM Daily Features for a month at a time. Features have been posted on most days since February 2002. List all feature titles.
Thu Mar 01, 2018

February Precip Hours
01 Mar 2018 05:33 AM
February was a wet month for some parts of the state. The featured chart presents the number of hours with measurable precipitation reported by the Burlington (far southeastern Iowa) Airport weather station (ASOS). The chart shows the hourly totals for this year, the maximum and the average based on period of record data. These types of charts can sometimes be problematic during the cold season as not all sites are capable of reporting precipitation during snowfall events. Regardless, the 38 hours this month are only a few shy of the 1998 total of 46.
Voting: Good - 6 Bad - 0
Tags: feb18
Generate This Chart on Website
Fri Mar 02, 2018

March Temps + Wind
02 Mar 2018 05:33 AM
March started off mild for much of Iowa On Thursday. The mild afternoon temperatures were accompanied by brisk winds. The featured chart looks at the frequency of having 10+ knot wind speeds by a given air temperature for March for Cedar Rapids. The plot would indicate that as the temperature warms, wind speeds are more commonly stronger. These stronger wind speeds can help warm our near surface air temperatures by mixing down warmer air from above, or transporting warmer air from our south into the state, or sometimes we experience chinook style winds from the High Plains with descending air from the Rocky Mountains warming.
Voting: Good - 7 Bad - 0
Tags: mar
Generate This Chart on Website
Mon Mar 05, 2018

Winter Weather Advisories
05 Mar 2018 05:32 AM
A Winter Weather Advisory is in effect over far northern Iowa, which as the featured map shows, is the favored location for such an alert. The featured map depicts the average number of advisories issued per year given IEM archives back to 2005. The north to south gradient is clearly shown with far southern Iowa experiencing about half as many events. The advisory today is for intense snowfall rates.
Voting: Good - 13 Bad - 1
Generate This Chart on Website
Tue Mar 06, 2018

'17-'18 Winter Storm #20
06 Mar 2018 08:25 AM
The featured map displays snowfall reports so far from our current winter storm. Heavy rainfall was again observed over southeastern Iowa. The highest snowfall totals were over far northeastern Iowa with amounts over six inches. The wet snow, strong winds, and below freezing temperatures have made for some significant travel impacts over Iowa on Monday and Tuesday. Light snow continues to fall as the large storm system swirls over the state this morning. This map will be updated later today with any additional snowfall reported during today.
Voting: Good - 10 Bad - 1
Tags: winter1718
Wed Mar 07, 2018
Large Comma
07 Mar 2018 05:34 AM
The featured animated GIF is derived from multi-channel GOES-16 (GOES East) imagery attempting to show a "true color" depiction of what you would see from space. This loop is from Monday and shows the large cloud shield in the shape of a comma with the comma head showing a discernible rotation over Iowa. This system was 'stacked', which means the surface low pressure is vertically below the upper troposphere low pressure center. This type of cloud formation is common with mature and large storm systems.
Voting: Good - 17 Bad - 0
Tags: satellite
Thu Mar 08, 2018

Winter Snow Cover Days
08 Mar 2018 05:32 AM
The featured map presents a smoothed estimate of the number of days this winter season with at least one inch of snowfall on the ground. The map shows a large north to south gradient over the state with extreme northern Iowa having double the number of days of much of southeastern Iowa. Temperatures are expected to moderate some into the weekend and will help to melt away some more of the snow pack that exists over northern Iowa.
Voting: Good - 9 Bad - 1
Fri Mar 09, 2018

March Highs Above Freezing
09 Mar 2018 05:40 AM
The featured map is from an IEM Autoplot tool that allows comparison between two period of years. In this case, we are comparing the difference in average number of days per March with the daily high temperature above 32 degrees. The two 30 year periods compared are the most recent 30 years against the 30 years prior to that. The plot does not show much difference between the two periods with all values around +/- one day or less. You can generate more maps like this and pick the metric of your choice!
Voting: Good - 7 Bad - 3
Generate This Chart on Website
Sun Mar 11, 2018

'17-'18 Winter Storm #21
11 Mar 2018 09:49 PM
The weekend before most schools enjoy spring break brought a bit of snow to the state. The featured analysis depicts generally light amounts of snow with a few locations picking up more substantial totals. Much of this snow is expected to melt on Monday with highs back above freezing.
Voting: Good - 9 Bad - 1
Tags: winter1718
Tue Mar 13, 2018

Regaining our lost hour
13 Mar 2018 06:38 AM
If the IEM Daily Feature has done anything over the past 16 years, it has properly pointed out the scam that is "Daylight Saving Time". The featured map depicts the number of days it will take to regain the hour of morning sunshine that was lost due to the time change this past weekend. Of course, some locations do not observe DST, so this map is only a smoothed presentation for the entire continental US. For Iowa, it will take just over a month, for locations to our south, it takes even longer to regain the hour of morning sunshine.
Voting: Good - 11 Bad - 1
Tags: dst
Wed Mar 14, 2018

Second Windiest Month
14 Mar 2018 05:41 AM
Winds were a bit gusty Tuesday afternoon, which fits the bill for March in Iowa. The featured chart displays the monthly averaged wind speed and direction for Ames based on period of record data at the airport. March comes in as second windiest behind April. It is kind of interesting to denote the progression of average wind direction over the year. We are still in a period with prevailing northwesterly winds, so bouts of cold are more common than not thanks to that wind. Once we get into May, then the warmer southwesterlies start to dominate.
Voting: Good - 8 Bad - 1
Tags: wind
Generate This Chart on Website
Thu Mar 15, 2018

Ides of March Highs
15 Mar 2018 05:09 AM
The 15th of March was a bad day for Julius Caesar, but looks to be a pleasant early spring day for Iowa. The featured chart looks at the historical daily high temperatures on the 15th for Des Moines, the actual high this year will be above the long term average for the date. A bit of winter is expected to return on Friday with a mixture of precipitation forecasted.
Voting: Good - 4 Bad - 0
Generate This Chart on Website
Fri Mar 16, 2018

50+ High Temp Days
16 Mar 2018 05:38 AM
The featured chart displays the number of year to date days with a daily high temperature of at least 50 degrees. This year's total is slightly below long term average, but at least it is a non-zero number. A number of years plotted on this chart failed to reach 50+ by the 15th of March for that given year. The forecast does not have much for 50+ degrees over the next seven days, so our below average year looks to continue.
Voting: Good - 8 Bad - 1
Generate This Chart on Website
Sun Mar 18, 2018

'17-'18 Winter Storm #22
18 Mar 2018 12:40 PM
Our most recent winter storm dumped a remarkably tight gradient of heavy snowfall between Des Moines and Ames. The featured map is an attempted analysis of available reports, but is likely not fully representing the very sharp gradient that occurred. This tight gradient was thanks to a small scale snow producing band that pivoted over the same area for a number of hours on Saturday. The snowfall was extremely wet as well with snow to liquid water ratios below 10. Much of this snow melted later on Saturday. Will have more features on this event later this week!
Voting: Good - 18 Bad - 1
Tags: winter1718
Tue Mar 20, 2018

Remarkable Snowfall Gradient
20 Mar 2018 05:32 AM
This past weekend's storm left a remarkable gradient of snowfall over central Iowa. The featured map combines MRMS RADAR based precipitation estimates (these would be liquid totals) and NWS received Local Storm Reports (snow fall in inches). The gradient displayed goes from under a half inch over southern Des Moines to 8 inches at Huxley and then an inch or two for Ames. The RADAR estimates nicely coincide with these reports with the bulls-eye over Huxley. All of this snowfall is already gone as temperatures warmed very nicely on Monday.
Voting: Good - 15 Bad - 1
Tags: winter1718
Wed Mar 21, 2018

Only Two Days with 40+ Dew Points
21 Mar 2018 05:33 AM
The featured chart displays the daily range between the low and high dew point temperature for Ames so far this year. Days with the dew point above 40 for part of the day are highlighted in red. Only two days are shown so far, which is below long term average (not shown on plot). We typically see a few days with the dew point above 50F by now and the forecast looks to continue the trend this year of rather low dew points.
Voting: Good - 6 Bad - 1
Generate This Chart on Website
Thu Mar 22, 2018
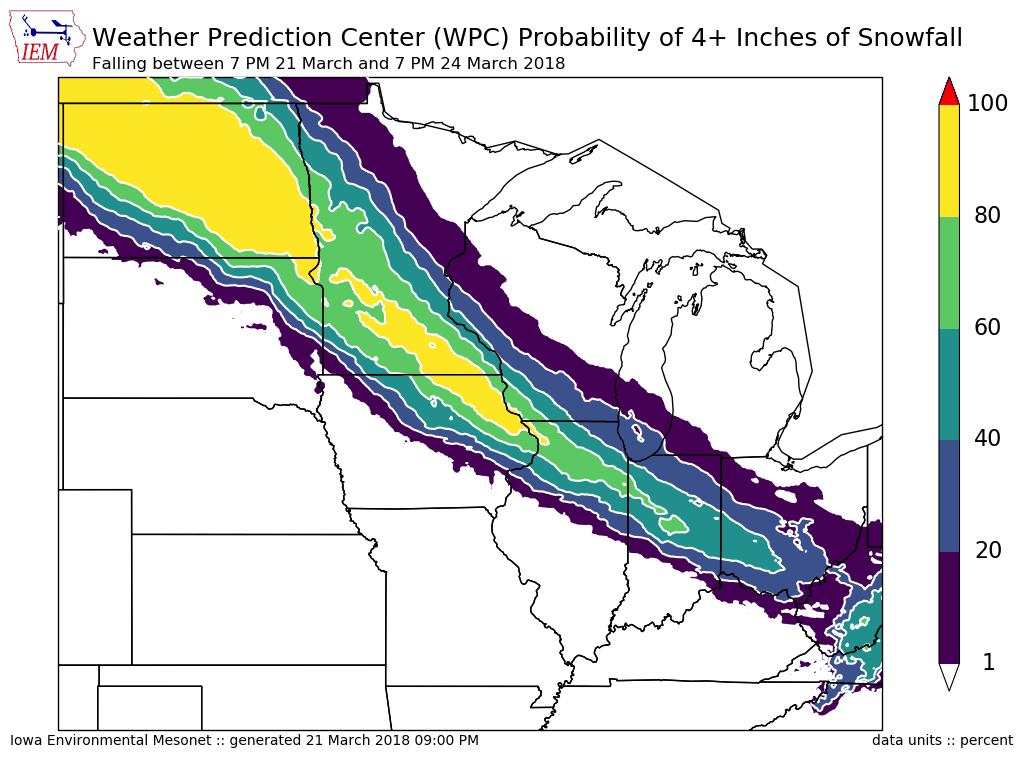
Chance of 4+ Inches
22 Mar 2018 05:35 AM
The featured map is forecast probabilities of at least four inches of snow falling over the next 72 hours from the Weather Prediction Center (a part of NWS/NOAA). This will be from a big storm system arriving on Friday and set to bring a lot of moisture into the state. The question remains as to where the rain to snow transition will be and the featured map depicts a forecast location of north and northeastern Iowa. Other parts of the state are expected to receive significant amounts of rain.
Voting: Good - 10 Bad - 0
Tags: wpc
Fri Mar 23, 2018
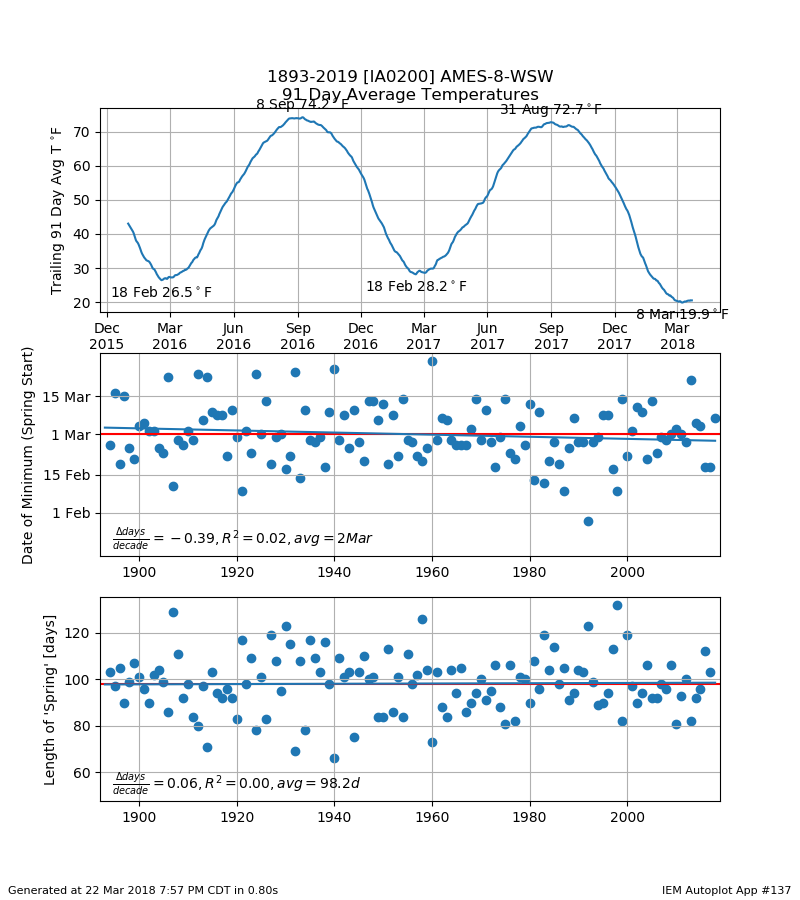
Been Spring for a Few Weeks
23 Mar 2018 05:30 AM
There are a number of ways to denote the start date of spring. Meteorological Spring consists of the full months of March, April and May. The Astronomical Spring is the period between the spring equinox and summer solstice and due to the Earth's eccentricity and leap days, the period is not exactly the same period of days each year. So we have either been in spring for a few days or a few weeks depending on how you count. Another way to compute the spring period is to split the year into 91 day chunks and then have spring start after the coldest 91 consecutive stretch of days ends. The featured chart does just that and shows the end dates of the coldest and warmest 91 day stretch each year. If you then back out the period of days between the coldest and warmest stretch, you end up with spring! The bottom two panels provide some long term metrics for the number of days and start date for Ames. This metric indicates spring starting on March 9th, so that's the answer!
Voting: Good - 13 Bad - 2
Tags: spring
Generate This Chart on Website
Sun Mar 25, 2018

'17-'18 Winter Storm #23
25 Mar 2018 12:23 PM
Our most recent winter storm produced the largest totals of snowfall so far this season. The featured map displays an analysis of NWS Local Storm Reports, COOP, and CoCoRaHS observations. There was a sharp gradient of snowfall on the northern side with far northeastern Iowa indicated missing out completely. Totals over a foot were reported from Mason City south and east to Davenport. This snowfall was very heavy with snow to liquid ratios well below ten. These late season snowfalls do not tend to stick around long and any sunshine is able to make quick work of snow on concrete surfaces.
Voting: Good - 17 Bad - 1
Tags: winter1718
Mon Mar 26, 2018

Severe Thunderstorm Threats
26 Mar 2018 08:57 PM
This week is Severe Weather Awareness Week with Monday focusing on severe thunderstorms. The National Weather Service issues a Severe Thunderstorm Warning when it expects damaging winds over 58+ MPH and/or hail larger than one inch diameter. When the NWS issues their warning, it includes coded "tags" indicating their estimated wind speed and/or hail size. The featured chart looks at the frequency of these tags within the warnings. The most common thunderstorm warning (over one in three) is for 60 MPH winds and one inch hail. Thankfully the frequencies drop off considerable has you move to more intense thresholds. Iowa has yet to see a Severe Thunderstorm Warning yet this year. The peak for these warnings comes in late June.
Voting: Good - 11 Bad - 0
Tags: swaw ibw nws
Generate This Chart on Website
Tue Mar 27, 2018
NWS Warning Reception
27 Mar 2018 11:06 AM
This is Severe Weather Awareness Week in Iowa and Tuesday's topic is warning reception. There are many ways to receive alerts when the NWS issues a warning for your location. Relying on hearing a siren before taking action is problematic as sirens are meant to alert folks while outdoors and are single points of failure. Sirens also are not used to alert people to threats like flash floods. The NWS has provided a few links for your review
The IEM provides a number of non-operational / educational ways to receive NWS
Warnings. These include services provided by "IEMBot" such as RSS
feeeds, Twitter automated posts, and real-time web apps.
Voting: Good - 4 Bad - 0
Tags: swaw nws
Wed Mar 28, 2018

Tornado Warning Polygons
28 Mar 2018 05:33 AM
This is Severe Weather Awareness Week in Iowa and Wednesday's topic is tornadoes. Tornadoes have been recorded in Iowa during each month of the year and about every hour of the day. The NWS issues Tornado Warning "Storm Based Warnings" in the form of geographic polygons. While the featured map may look like your grandmother's quilt, it is actually a map showing the last year a location in the state was under a Tornado Warning. The archive for these polygons goes back to 2002, but they were not the operational warning until late 2007. There are a number of interesting artifacts on the map including some slivers of the state that have not seen a polygon Tornado Warning since at least 2002. You can generate maps like these on this website for other states along with many other options too!
Voting: Good - 15 Bad - 1
Tags: swaw nws tornado
Generate This Chart on Website
Thu Mar 29, 2018

Severe TStorm Warnings by Time of Day
29 Mar 2018 05:34 AM
This is Severe Weather Awareness Week in Iowa and Thursday's topic is family preparedness. Severe Thunderstorms are possible at any time of the day and at times when your family may not be home together. The point is to think about how your family receives warnings when not all together, takes action on those warnings, and advises each other of their status during and after the event. Along these lines, the featured chart presents the time of day frequency of Severe Thunderstorm Warnings issued by NWS Des Moines. While certainly there is a peak in frequency around 6-7 PM, the rest of the day are non-zero values meaning severe storms are possible during all hours of the day. Thankfully individual storm systems provide more narrowed threats in time and the vast majority of days in Iowa are severe storm free. These events are rare enough that it is important to raise awareness and review your action plans in early spring each year.
Voting: Good - 11 Bad - 1
Tags: swaw nws warnings
Generate This Chart on Website
Fri Mar 30, 2018

One Hour Flash Flood Guidance
30 Mar 2018 05:33 AM
Today wraps up Severe Weather Awareness Week in Iowa and today's topic is flooding. Flooding is one of the top weather related cause of fatalities in the United States. Flooding can happen quickly as a result of heavy rainfall and the featured map is a diagnostic on how much rainfall is needed over an hour to result in non-urban area flash flooding. This product is generated by the National Weather Service River Forecast Center and you can generate maps like these on the website for current and archived dates.
Voting: Good - 13 Bad - 20
Tags: swaw ffg
Generate This Chart on Website