Past Features
This page lists out the IEM Daily Features for a month at a time. Features have been posted on most days since February 2002. List all feature titles.
Fri Dec 01, 2017

November Highs and Lows
01 Dec 2017 05:33 AM
The calendar has turned to December, so it is a good time to look back on November. The featured chart displays a heatmap of daily high and low temperatures for November for Ames. Actual observations for this past November are overlaid. Temperatures were generally within the higher frequencies based on long term data, even though the actual time series of data for the month featured a chilly start and warm end to the month. The heatmap also shows the combination with the highest frequencies, which is a high between 47 and 50 along with a low between 29 and 32.
Voting: Good - 8 Bad - 0
Tags: nov
Generate This Chart on Website
Mon Dec 04, 2017

Fall Highs Above Average
04 Dec 2017 05:32 AM
The fall season encompassing the full months of Sep, Oct, and Nov wrapped up last week. The featured chart looks at the percentage of days for the period that had a high temperature above average. The overall average is plotted as well and is slightly different than an even 50% due to asymmetries of the high temperature distribution. Anyway, years above this value are shown in red and below in blue. This fall was near 50% whereas the previous two where much higher for Ames. It has been about 20 years since the last fall season with substantially lower than 50% of the days above average for the fall season.
Voting: Good - 6 Bad - 2
Tags: fall
Generate This Chart on Website
Tue Dec 05, 2017

Warm December Temperatures
05 Dec 2017 05:35 AM
Warm and muggy air streamed into Iowa on Monday before being swept out by a cold front passage Monday evening. A harsh reminder of the current winter season impacted the state over night. But before then, Des Moines was able to tie its all-time warmest December temperature of 69 degrees. The featured table looks at the hourly temperature reports from Sunday into Monday for Des Moines and the previous hour for December with as warm of a temperature. For 8 AM and Noon yesterday, the hourly temperature was the warmest on record based on IEM archives for the site.
Voting: Good - 6 Bad - 1
Tags: dec17
Wed Dec 06, 2017

Tied December Max
06 Dec 2017 05:33 AM
The quick turn of our weather to winter on Tuesday made Monday seem like a distant memory. The highs on Monday were some of the warmest possible during December and Des Moines was able to tie its all time record high temperature for the month. The featured chart displays the monthly maximum temperature records for the site. One can use the values in comparison to other months, so the 69 on Monday is comparable to seeing 110 in July!
Voting: Good - 14 Bad - 1
Tags: dec17
Generate This Chart on Website
Thu Dec 07, 2017

Consecutive Day Stats
07 Dec 2017 05:34 AM
The featured chart presents consecutive day statistics for Ames based on long term daily high temperatures. The chart shows the maximum and minimum values of high temperature over a given number of consecutive days. For example, over a fifteen day period, the high temperature has averaged over 100 degrees and been over 100 degrees each day for the warmest period on record. Again for fifteen days, the coldest average high has been zero degrees with the high each day below about five degrees. Of course, we are nearer to the colder end of this range and even attempting such a cold period would require snow cover.
Voting: Good - 5 Bad - 10
Generate This Chart on Website
Fri Dec 08, 2017

Dry Month and a Half
08 Dec 2017 05:34 AM
The featured chart displays precipitation totals for Des Moines between 22 October and 7 December each year. The 21rst of October was the last significant rainfall for the site. This year's total between the given days is about the lowest on record behind 1904. Of course, with the growing season long over, the impacts of the dry weather are minimal and it was a major help to dry out area fields to allow crop harvest to proceed. But one starts to wonder if we are going to have a minimal amount of snowfall like last year again, and go into the next year's growing season needing moisture.
Voting: Good - 6 Bad - 0
Generate This Chart on Website
Mon Dec 11, 2017
Days since last Winter Storm Warning
11 Dec 2017 05:33 AM
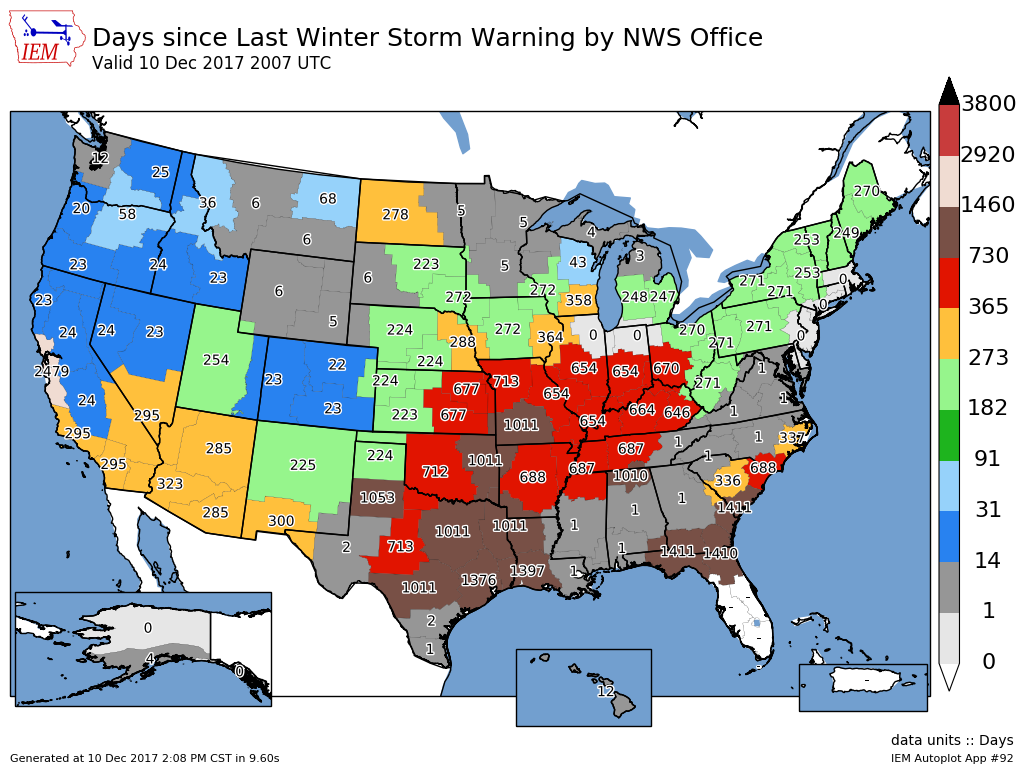
Significant snowfall events continue to be elusive this season for Iowa. The featured map displays the number of days since the last issuance of a Winter Storm Warning by NWS Forecast Office. All of the Iowa shown forecast offices have yet to issue such an alert this season and Davenport has gone a full year without issuance. Of course, the highlight of the map is the comparison with the deep south offices that just wrapped up a significant winter storm for their area. Snow was experienced from Houston to DC. Amazing to think that a place like Mobile, AL experienced a significant winter snow before Iowa did.
Voting: Good - 13 Bad - 1
Generate This Chart on Website
11 Dec 2017 05:33 AM
Significant snowfall events continue to be elusive this season for Iowa. The featured map displays the number of days since the last issuance of a Winter Storm Warning by NWS Forecast Office. All of the Iowa shown forecast offices have yet to issue such an alert this season and Davenport has gone a full year without issuance. Of course, the highlight of the map is the comparison with the deep south offices that just wrapped up a significant winter storm for their area. Snow was experienced from Houston to DC. Amazing to think that a place like Mobile, AL experienced a significant winter snow before Iowa did.
Voting: Good - 13 Bad - 1
Generate This Chart on Website
Tue Dec 12, 2017
'17-'18 Winter Storm #1
12 Dec 2017 07:55 AM
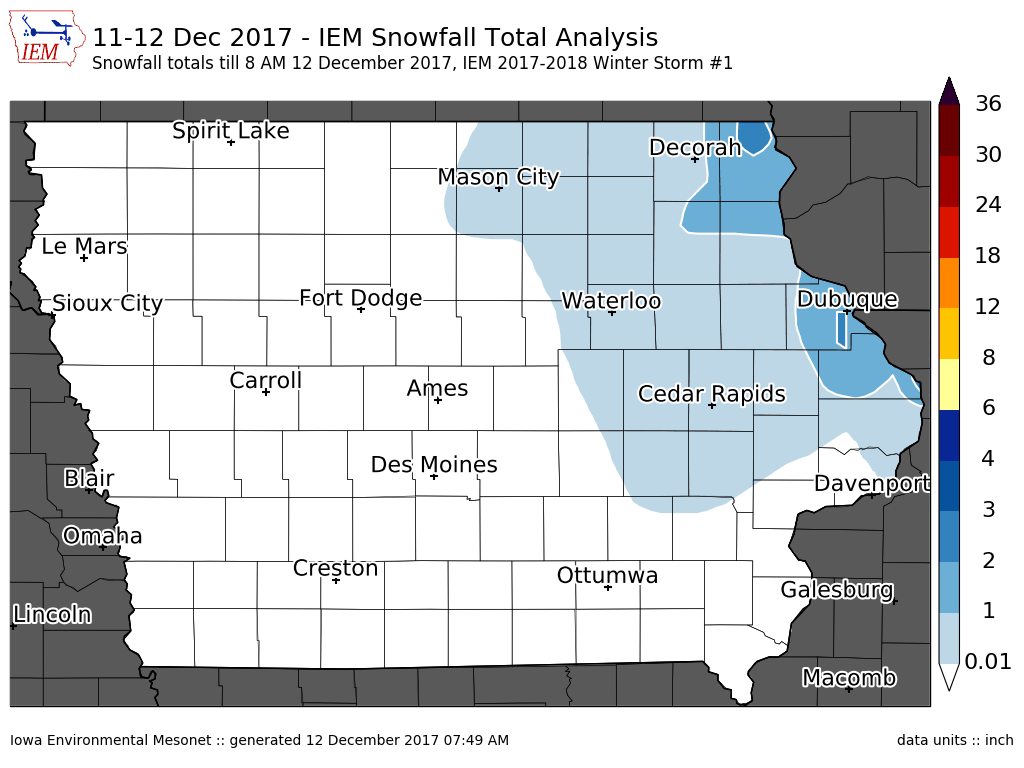
The IEM generates snowfall analysis maps based on NWS COOP observations, Local Storm Reports, and CoCoRaHS reports. The arbitrary requirement for classifying these events as storms is for somewhere in Iowa to receive 2+ inches of snow or to have significant impacts from ice and/or blowing snow. So far NE Iowa has some isolated totals of two inches, so we have our first "winter storm" of the season. There have been other light snow producers in the state this season, but only have seen an inch or less reported. Look for more maps like these as the season progresses and the "Winter Storms of 2017- 2018" link on the homepage will bring you to a page showing all these maps.
Voting: Good - 6 Bad - 1
Tags: winter1718
12 Dec 2017 07:55 AM
The IEM generates snowfall analysis maps based on NWS COOP observations, Local Storm Reports, and CoCoRaHS reports. The arbitrary requirement for classifying these events as storms is for somewhere in Iowa to receive 2+ inches of snow or to have significant impacts from ice and/or blowing snow. So far NE Iowa has some isolated totals of two inches, so we have our first "winter storm" of the season. There have been other light snow producers in the state this season, but only have seen an inch or less reported. Look for more maps like these as the season progresses and the "Winter Storms of 2017- 2018" link on the homepage will bring you to a page showing all these maps.
Voting: Good - 6 Bad - 1
Tags: winter1718
Wed Dec 13, 2017

Waiting for first inch
13 Dec 2017 05:33 AM
While places like Ames have seen flurries this season, any snow of consequence has been elusive. The featured chart displays the date of the first winter season one plus inch snowfall, the amount of that snowfall and the number of days until no snow cover was reported. By mid-December, about 75% of years have seen an inch plus of snowfall by now. So our current snowfall drought this season is not too exceptional.
Voting: Good - 11 Bad - 4
Generate This Chart on Website
Thu Dec 14, 2017
Wind Advisories per Year
14 Dec 2017 05:34 AM
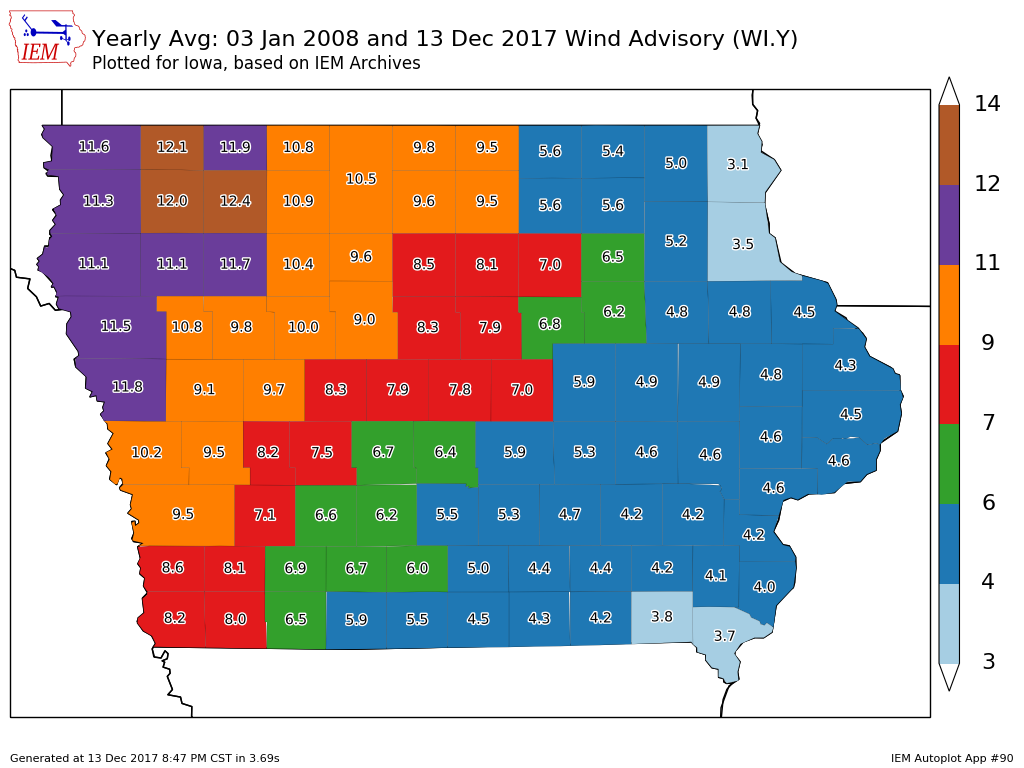
The wind was howling again yesterday in Iowa prompting the NWS to issue a Wind Advisory for much of the state. The featured map looks at how common these advisories are by plotting the average number of advisories per year by county based on IEM archives. The general northwest to southeast pattern is rather clear with about three times as many issued between the extremes. Why does this difference exist? Local topography and land cover has some impact as western Iowa is flatter along with fewer trees. It is also closer to the "High Plains", which tends to be an area experiencing rapidly developing low pressure systems that help drive strong winds and drier landscapes which help mix deeper depths of the atmosphere (helps to bring stronger winds to the surface).
Voting: Good - 8 Bad - 2
Tags: wind
Generate This Chart on Website
14 Dec 2017 05:34 AM
The wind was howling again yesterday in Iowa prompting the NWS to issue a Wind Advisory for much of the state. The featured map looks at how common these advisories are by plotting the average number of advisories per year by county based on IEM archives. The general northwest to southeast pattern is rather clear with about three times as many issued between the extremes. Why does this difference exist? Local topography and land cover has some impact as western Iowa is flatter along with fewer trees. It is also closer to the "High Plains", which tends to be an area experiencing rapidly developing low pressure systems that help drive strong winds and drier landscapes which help mix deeper depths of the atmosphere (helps to bring stronger winds to the surface).
Voting: Good - 8 Bad - 2
Tags: wind
Generate This Chart on Website
Fri Dec 15, 2017
Continued Drought
15 Dec 2017 05:35 AM
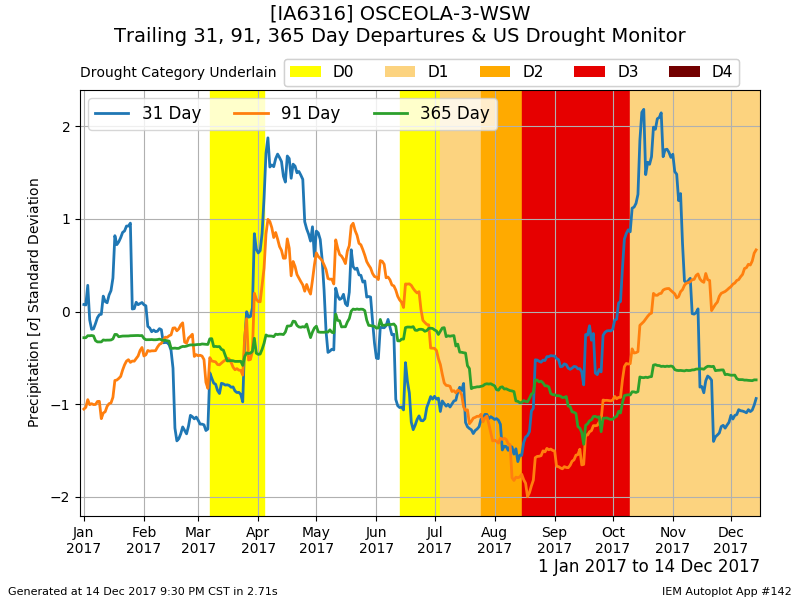
The weekly US Drought Monitor was released yesterday and depicts a worsening drought situation in the state. While heavy rains frequented the state in October, we have turned very dry again. The featured chart presents the combination of trailing day precipitation departures expressed in terms of standard deviations from long term averages for Osceola (just south of Des Moines). The shaded areas represent the US Drought Monitor conditions analyzed for the location. This area was particularly hard hit this year and while the heavy rains in October did remove the D3 category, the area has remained in D2 since. There is no one magic metric that determines the drought category, but a number of metrics are considered and local reported impacts.
Voting: Good - 14 Bad - 3
Tags: usdm
Generate This Chart on Website
15 Dec 2017 05:35 AM
The weekly US Drought Monitor was released yesterday and depicts a worsening drought situation in the state. While heavy rains frequented the state in October, we have turned very dry again. The featured chart presents the combination of trailing day precipitation departures expressed in terms of standard deviations from long term averages for Osceola (just south of Des Moines). The shaded areas represent the US Drought Monitor conditions analyzed for the location. This area was particularly hard hit this year and while the heavy rains in October did remove the D3 category, the area has remained in D2 since. There is no one magic metric that determines the drought category, but a number of metrics are considered and local reported impacts.
Voting: Good - 14 Bad - 3
Tags: usdm
Generate This Chart on Website
Mon Dec 18, 2017

Dry Eight Weeks
18 Dec 2017 05:32 AM
The featured table shows daily precipitation reports for Des Moines since 22 October. We are now working on our ninth mostly dry week in a row. The two tenths on November 18th is the only precipitation event of consequence for this period and of course, there has been no measurable snow either. For those wanting precipitation and even a white Christmas, there is some hope in the forecast models with at least a big storm present somewhere in the Midwest by the end of the week.
Voting: Good - 9 Bad - 1
Generate This Chart on Website
Tue Dec 19, 2017

Period between Two Tenths
19 Dec 2017 05:34 AM
Yesterday's IEM Daily Feature denoted the long period it has been since the Des Moines airport last reported two tenths of an inch of precipitation. The featured chart today looks at the longest stretches between daily precipitation totals of that amount for the site. The current stretch of days stands at 30, which is well below the longest streak on record for mid December and much longer streaks exist the deeper into winter you go. The chart also depicts the longest stretches of having no measurable precipitation and the largest single day accumulations.
Voting: Good - 8 Bad - 0
Generate This Chart on Website
Wed Dec 20, 2017
December Hours of 50+
20 Dec 2017 05:34 AM
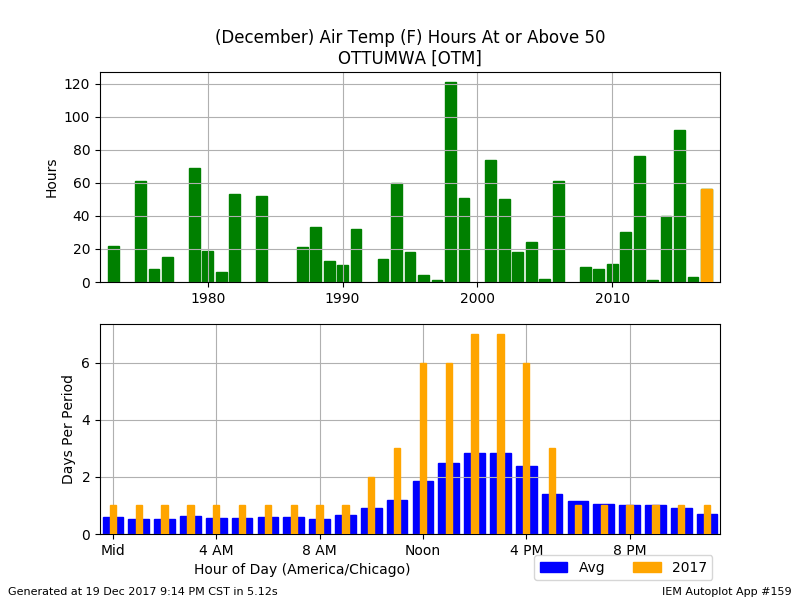
Temperatures were very mild again on Tuesday with highs well into the 40s and even some 50s over Iowa. Some places, like Ottumwa, were able to enjoy a hour or more of temperatures in the 50s. How common are hourly temperatures in the 50s for December? The featured chart looks into that using period of record data for the site during December. The top chart provides the total number of hourly temperature reports at or above 50 degrees and the bottom report shows the average and 2017 totals by hour of the day. Our total this year is below totals from a number of recent years, but still well above average. Unfortunately, it would not appear likely that these totals will be added to for the rest of the month as much colder weather will arrive soon.
Voting: Good - 4 Bad - 0
Tags: dec
Generate This Chart on Website
20 Dec 2017 05:34 AM
Temperatures were very mild again on Tuesday with highs well into the 40s and even some 50s over Iowa. Some places, like Ottumwa, were able to enjoy a hour or more of temperatures in the 50s. How common are hourly temperatures in the 50s for December? The featured chart looks into that using period of record data for the site during December. The top chart provides the total number of hourly temperature reports at or above 50 degrees and the bottom report shows the average and 2017 totals by hour of the day. Our total this year is below totals from a number of recent years, but still well above average. Unfortunately, it would not appear likely that these totals will be added to for the rest of the month as much colder weather will arrive soon.
Voting: Good - 4 Bad - 0
Tags: dec
Generate This Chart on Website
Thu Dec 21, 2017

Warm December Soils
21 Dec 2017 05:35 AM
The featured chart displays yearly time series of four inch depth soil temperatures for an ISU Soil Moisture Network station just north of Ames. The blue lines are each of the previous years on record, the red line is this year and the black line is a simple average of all previous years. The lack of snow and mild air temperatures have average current soil temperatures above freezing freezing and above average for mid December. These conditions are good for late season construction projects and even agricultural field work, like tiling.
Voting: Good - 6 Bad - 0
Generate This Chart on Website
Fri Dec 22, 2017

Limited Poor Travel Conditions
22 Dec 2017 05:34 AM
The featured map displays the total amount of time that a DOT reported road segment was in an non-seasonable condition, meaning a condition that was neither dry nor wet from rain, so far this winter season. Difficult winter weather driving has been rare so far, with the conditions on Thursday the most widespread seen so far. The lack of snow will be disappointing for those wanting a White Christmas, but will help those needing to travel over the river and through the woods to Grandmother's house.
Voting: Good - 13 Bad - 1
Tags: roads
Mon Dec 25, 2017

'17-'18 Winter Storm #2
25 Dec 2017 06:30 AM
A light and fluffy snowfall arrived just in time to make for a white Christmas for much of southern Iowa. The featured map displays an IEM analysis of available snowfall reports from the NWS. Two to four inches were common over far southern Iowa with values generally an inch or less over northern Iowa. Very cold air has now settled into the state making for a very Christmas Day. The very cold air looks to stick around until the end of this year.
Voting: Good - 5 Bad - 0
Tags: winter1718
Tue Dec 26, 2017

Accum Wind Chill Time
26 Dec 2017 07:06 AM
The coldest air of the season is currently impacting the state with some bitterly cold wind chills prompting the issuance of Wind Chill Advisories. The featured chart looks at the accumulated amount of time that Des Moines has a wind chill temperature at or below the given temperature. This plot only considers cases when the wind was blowing strong enough to be measured. The totals this far for 2017 are well below average, but of course, we are just getting started for the season! Some even colder air is expected later this week.
Voting: Good - 6 Bad - 0
Tags: windchill
Generate This Chart on Website
Wed Dec 27, 2017
6th Most Common
27 Dec 2017 06:52 AM
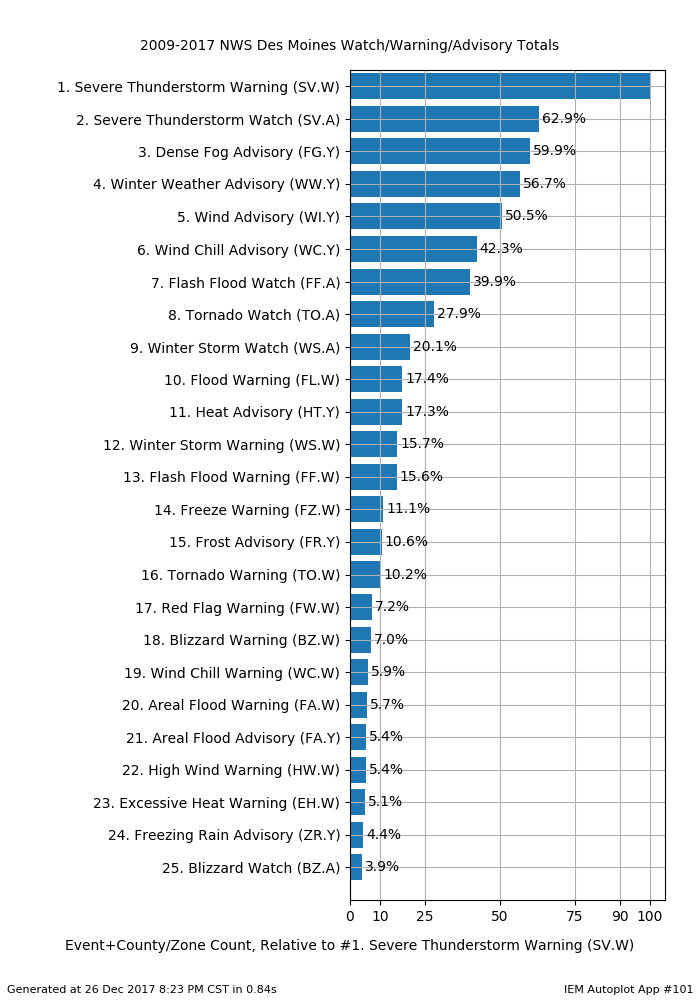
The NWS has the entire state under a Wind Chill Advisory this morning. As measured by the number of unique events by a forecast county/zone, this advisory is the sixth most commonly issued alert by the NWS Des Moines. The featured table presents the relative frequency of an alert as issued by NWS Des Moines against the most common alert, the Severe Thunderstorm Warning. The relative percent indicates in bulk that a severe thunderstorm event is twice as common as a wind chill advisory. The Wind Chill Warning has colder thresholds for alerting than the advisory and appropriately appears at much lower frequencies for the chart.
Voting: Good - 8 Bad - 0
Tags: nws
Generate This Chart on Website
27 Dec 2017 06:52 AM
The NWS has the entire state under a Wind Chill Advisory this morning. As measured by the number of unique events by a forecast county/zone, this advisory is the sixth most commonly issued alert by the NWS Des Moines. The featured table presents the relative frequency of an alert as issued by NWS Des Moines against the most common alert, the Severe Thunderstorm Warning. The relative percent indicates in bulk that a severe thunderstorm event is twice as common as a wind chill advisory. The Wind Chill Warning has colder thresholds for alerting than the advisory and appropriately appears at much lower frequencies for the chart.
Voting: Good - 8 Bad - 0
Tags: nws
Generate This Chart on Website
Fri Dec 29, 2017

'17-'18 Winter Storm #3
29 Dec 2017 07:18 AM
Our latest snowfall producing storm brought just an inch or two to much of the state. The event came in two waves on Wednesday and Thursday. Given the holiday season, light totals and accumulation over two reporting days, reports were a bit sparse for this map. Regardless the highest totals stretched from Sioux City to southeast to Keokuk. More snow is on the way for today with more significant totals expected.
Voting: Good - 9 Bad - 0
Tags: winter1718
Sat Dec 30, 2017
'17-'18 Winter Storm #4
30 Dec 2017 09:20 AM
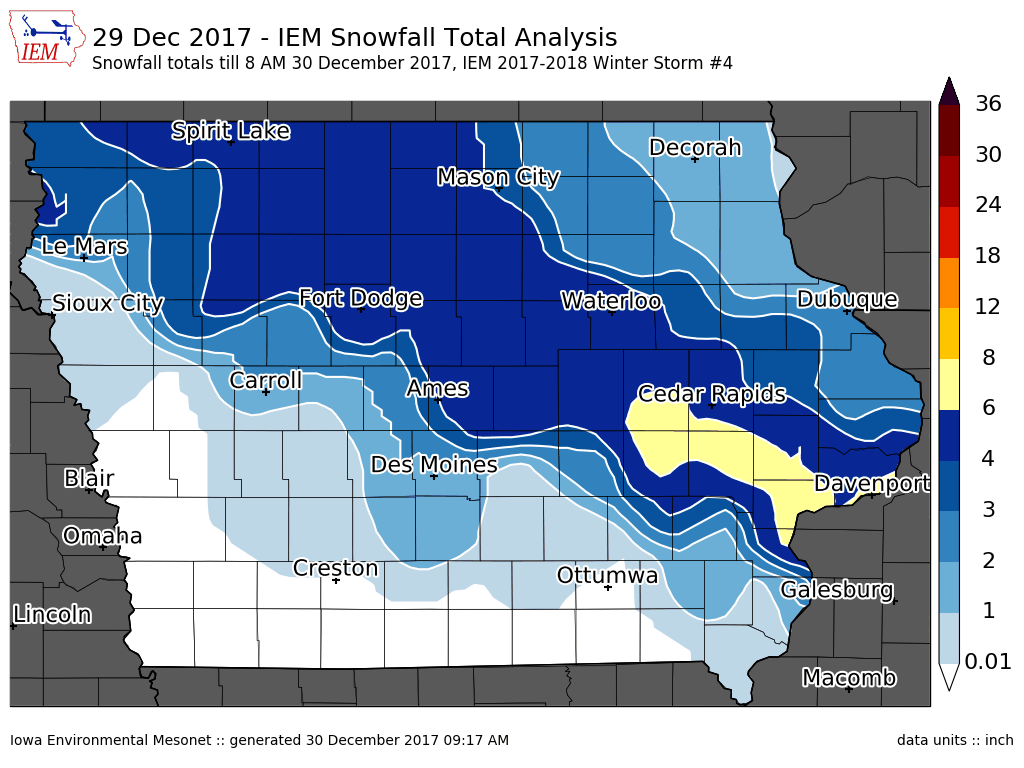
The heaviest snow storm of the season dumped four to eight inches over a stripe of Iowa yesterday. Totals rapidly dropped off to the south of this stripe. Some freezing drizzle was also observed with this storm. Extremely cold air has now invaded the state and will stick around into the new year.
Voting: Good - 7 Bad - 0
Tags: winter1718
30 Dec 2017 09:20 AM
The heaviest snow storm of the season dumped four to eight inches over a stripe of Iowa yesterday. Totals rapidly dropped off to the south of this stripe. Some freezing drizzle was also observed with this storm. Extremely cold air has now invaded the state and will stick around into the new year.
Voting: Good - 7 Bad - 0
Tags: winter1718
Sun Dec 31, 2017

'17-'18 Winter Storm #5
31 Dec 2017 10:24 PM
The snow producing storm systems have been coming quickly recently. The most recent system dumped an inch or two of fluffy snow over the state with the highest totals confined to west-central Iowa. As with some of the previous snowfalls, the usage of the term "winter storm" is probably generous for how "strong" the snow producing system is. Putting that aside, the snow dumped by these systems do have to be dealt with and do create travel headaches.
Voting: Good - 0 Bad - 0
Tags: winter1718