Past Features
This page lists out the IEM Daily Features for a month at a time. Features have been posted on most days since February 2002. List all feature titles.
Tue Aug 01, 2017

3 weeks before and after 25 July
01 Aug 2017 05:36 AM
High temperatures since the 25th of July have been rather pleasant in the state and generally in the 80s. This stretch to end July interrupted what otherwise was a very hot stretch of weather. The featured chart compares the average high temperature for the three weeks prior to 25 July with the three weeks afterwards. Some quadrant diagnostics are included to show how the population is distributed. It is kind of interesting to see how the averages are not much different for these two periods. The current forecast looks to maintain the mild conditions, so this year's comparison looks to be well into the fourth quadrant.
Voting: Good - 5 Bad - 2
Generate This Chart on Website
Wed Aug 02, 2017

Better than no rain at all
02 Aug 2017 05:16 AM
The receipt of rainfall continues to be a struggle for most of the state this summer. Some portions of the state did pick up some rain last evening as shown by the featured MRMS estimates. Totals were generally less than a half inch, but for those that did get some rain, every drop counts at this point. More rainfall chances are in the forecast, but it remains to be seen how much will fall on the driest areas in the state.
Voting: Good - 10 Bad - 0
Generate This Chart on Website
Thu Aug 03, 2017

Smallest Day to Day Changes
03 Aug 2017 05:33 AM
The featured chart displays a histogram of 24 hour temperature changes based on hourly observations. It is interesting to note that the variability expressed in this chart is minimized about this time of the year. Rewording, this is the most likely time of year that the temperature in 24 hours is close to the current temperature. The weather this week mostly resembles this statement with pleasant highs and cooler overnight lows.
Voting: Good - 11 Bad - 0
Generate This Chart on Website
Fri Aug 04, 2017

First Fall Sub 50
04 Aug 2017 05:33 AM
The coolest weather of the season arrived on Thursday and temperatures have dropped nicely overnight with some locations having a low temperature below 50 degrees for the first time since 1 July. The featured chart displays the period each year between the last spring and first fall low temperature below 50 degrees for Spencer. The year is split at 1 July for the purposes of this chart. So having the first sub 50 low during the first week of August is nothing out of the ordinary for the location and even a little bit later than average.
Voting: Good - 5 Bad - 0
Generate This Chart on Website
Mon Aug 07, 2017

Coldest High of August
07 Aug 2017 05:33 AM
The high temperature for Sioux City on Saturday reached a mere 66 degrees. There is a fair chance that this could be the day with the coldest high for the month. How rare is it for the coldest high to occur this early in August? The featured chart attempts to answer that question with the frequency of a given day of August having the coldest temperature. This situation is not all that infrequent with plenty either years having the coldest high temp this early in the month. The pleasant temperatures look to continue this week.
Voting: Good - 4 Bad - 0
Tags: aug
Generate This Chart on Website
Tue Aug 08, 2017

90 Day Departures
08 Aug 2017 05:34 AM
The featured map displays MRMS precipitation departures over the past 90 days expressed as a percentage of long term average. The long term average being an analysis of climate station data. The most recent US Drought Monitor depiction is overlain for comparison. The map shows the current "D2" depiction over south central Iowa having some of the lowest percent of average values.
Voting: Good - 8 Bad - 0
Generate This Chart on Website
Wed Aug 09, 2017

Flat August
09 Aug 2017 05:25 AM
The featured chart displays the daily high and low temperature climatology for Des Moines. While we have past the warmest days of the year on average, the trend for August is more flat than it is down. It is kind of interesting to see how the slide downwards really gets going in September. The month of August features elevated humidity levels, mature agricultural crops, and warm ground temperatures, all of which help to keep temperatures from fluctuating too wildly. The current near term forecast is a case in point with highs and lows about the same each day.
Voting: Good - 10 Bad - 0
Generate This Chart on Website
Thu Aug 10, 2017

2017 Humidity
10 Aug 2017 05:35 AM
Our somewhat strange early August weather continued on Wednesday with mild temperatures and low humidity levels. The featured chart displays a climatology of surface mixing ratio, which is a direct measure of the amount of moisture in the air. The daily averages for this year are placed in the context of long term daily averages and ranges. The bottom panel displays a departure from average. You can see how recent stretch has been well below average and running near the bottom of the range of what humidity levels have been during previous years.
Voting: Good - 12 Bad - 0
Tags: mixingratio
Generate This Chart on Website
Fri Aug 11, 2017

More time for summer
11 Aug 2017 05:32 AM
A few chilly evenings, preseason football, and school starting soon have many thinking thoughts of fall. If you consider the summer season to be the 91 day stretch with the warmest average temperature, there are still a few weeks left of summer! The featured chart displays the end date of the warmest 91 day period each year for Ames. A simple trend line is fitted and shows a slightly negative trend. Temperatures look to feel a bit cooler than typical for summer for the next week, but warmer temperatures are expected by late next week.
Voting: Good - 14 Bad - 0
Tags: summer
Generate This Chart on Website
Mon Aug 14, 2017

Trailing SPI
14 Aug 2017 05:34 AM
The lack of precipitation for most of the state remains the main story this growing season. The featured chart displays a couple of precipitation metrics for Des Moines. Each point on the x-axis represents the period from that date to August 13th. The orange, green, and black lines represent precipitation totals over the period of days. The blue line is the standardized precipitation index (SPI), which expresses a departure from average in terms of standard deviation. For Des Moines, the SPI is most negative since late May. Rewording , the most significant precipitation departures have been over the period from late May to today.
Voting: Good - 5 Bad - 2
Tags: spi
Generate This Chart on Website
Tue Aug 15, 2017

Over a month for an inch
15 Aug 2017 05:34 AM
Rain again frequented the state on Monday, but mostly missed the driest portions of the state over south central Iowa. Based on NOAA MRMS data, the featured map displays the number of days you have to go back prior to accumulating an inch of precipitation. South central Iowa really sticks out for this analysis with the yellows and blacks representing 35+ and 42+ days respectively. Rain continues to be in the forecast, but it again appears that the driest areas of the state may miss out.
Voting: Good - 8 Bad - 0
Generate This Chart on Website
Wed Aug 16, 2017

Much needed rainfall
16 Aug 2017 05:24 AM
Rainfall visited the state again on Tuesday with some significant totals over western Iowa this time. The featured chart looks at classifying where this rain fell in relation to previous 31 day departures from average. The blue bars represent the areal percentage of the state with the given 31 day departure and the orange bars provide the percentage of the state that picked up at least 0.1 inches for that departure based on NOAA MRMS estimates. The plot shows that about 90% of the state was running below average prior to yesterday's rainfall and that area received a majority of the rainfall.
Voting: Good - 7 Bad - 0
Generate This Chart on Website
Thu Aug 17, 2017

Muted August Range
17 Aug 2017 05:29 AM
The featured chart displays the range between the warmest high and coldest low for each August on record for Des Moines. The top panel displays the range between the two temperatures and the bottom panel shows the magnitude. The bar lines are the averages. It is kind of interesting to see that the recent year's August have almost all had below average range in temperature. Rewording, the range between the warmest high and coldest low is becoming less. One theory for this could be elevated humidity levels acting to keep overnight lows warmer and daytime highs cooler. The current forecast looks to continue the muted range with nothing too hot nor cold.
Voting: Good - 8 Bad - 1
Generate This Chart on Website
Fri Aug 18, 2017

Eclipse Sky Coverage Forecast
18 Aug 2017 05:34 AM
There is great excitement for the full solar eclipse that will transverse the entire CONUS on Monday. The featured map presents a recent NWS forecast of sky coverage at 1 PM CDT on Monday and the path of eclipse totality. For this chart, the darker areas represent locations with fewer clouds forecasted. At this point, the best eclipse viewing would appear to be over the northwestern US. If you are looking for somewhere closer to drive from Iowa, Nebraska appears to be a better bet at this time. Suffice it to say, there has never been this much interest nor forecaster attention given to a sky coverage forecast!
Voting: Good - 14 Bad - 1
Tags: eclipse
Mon Aug 21, 2017

Decision Time
21 Aug 2017 05:39 AM
You may have heard that there will be an eclipse today and if you are still deciding on where to go, the featured map presents the latest NWS forecast for sky coverage at 1 PM. The darker areas on the map represent the lowest sky coverage (least amount of clouds). It would still seem like Nebraska is the best bet for Iowans, but caveats galore with the amount of traffic likely on the roads today and the ongoing storms this morning complicating the forecast. If you are sticking around Iowa today, clouds look to be a problem for most of the state. Whatever you do, good luck and enjoy!
Voting: Good - 9 Bad - 0
Tags: eclipse
Tue Aug 22, 2017

Getting needed rainfall
22 Aug 2017 05:45 AM
Significant amounts of rain fell in the state yesterday with western Iowa picking up the heaviest totals. The featured map displays the combination of MRMS totals for the previous week and the latest US Drought Monitor. The precip totals are presented as a percentage of average for the week. It is rather remarkable to see nearly all of the greater than 100% values confined to the driest areas analyzed by the drought monitor. Some of the driest ares south of Des Moines missed out on the biggest rainfalls, but what was received was certainly better than nothing.
Voting: Good - 12 Bad - 0
Generate This Chart on Website
Wed Aug 23, 2017

80s for the fair
23 Aug 2017 05:36 AM
The Iowa State Fair came to a close on Sunday and set an attendance record at over 1,130,000 people. The weather certainly cooperated for much of the fair. The featured chart displays the percentage of hours for each year's fair that the temperature was at or above 80 degrees between 7 am and 10 pm. This year's total came in at just about average, but quite lower than 2016. These values are based on hourly reports from the Des Moines Airport. 2004 shows up as the least number of hours and 1983 as the most for this chart.
Voting: Good - 10 Bad - 0
Tags: statefair
Thu Aug 24, 2017

Losing ~10 degrees per month
24 Aug 2017 05:32 AM
With August coming to a close soon, our slide into fall starts in earnest during September. The featured chart displays the period between the average last fall season date for a given high temperature to the average first spring date with the number of days between these two dates shown on the right hand chart. Focusing on the left hand side, the decline in high temperature is roughly 10 degrees per month during the fall season. Meaning that we'd expect to see our last 90 to start September and then our last 80 by the end of September, on average. The actual forecast has us well away from 90 degrees through the end of August!
Voting: Good - 6 Bad - 1
Generate This Chart on Website
Fri Aug 25, 2017
Hurricane Harvey
25 Aug 2017 05:40 AM
It has been over 10 years since a major hurricane (Category 3 or higher) has made landfall on the United States. While technically still a Category 2, Harvey appears to be strengthening this morning and may make Category 3 strength before landfall. Regardless of the category, tremendous amounts of rain and storm surge are expected to bring significant issues to Texas and Louisiana.
Voting: Good - 15 Bad - 0
Tags: hurricane
Sat Aug 26, 2017
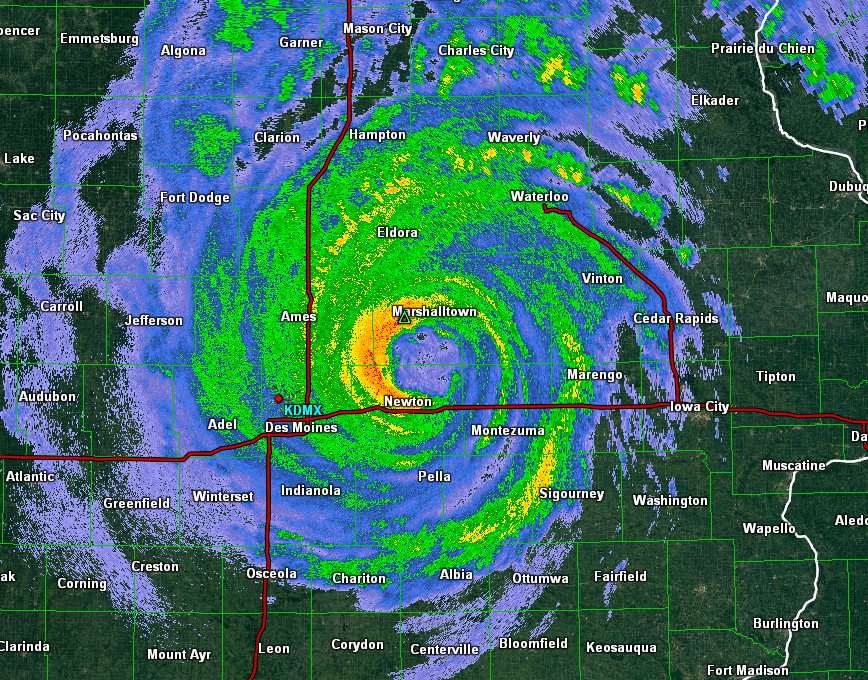
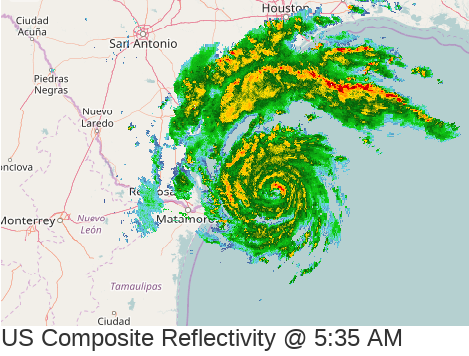
Harvey in Iowa
26 Aug 2017 03:16 PM
Hurricane Harvey roared onshore last night as a Category 4 storm. While the initial storm surge and extreme winds have subsided, day upon day of heavy rains are expected in the area as the storm takes its sweet time to move north. For the sake of perspective for us Iowans, the hurricane as depicted by Corpus Christi, TX NEXRAD last night is shown transposed into Iowa as if it was observed from the Des Moines NEXRAD. The scale of such storms is remarkable!
Voting: Good - 11 Bad - 0
Tags: hurricane
Mon Aug 28, 2017
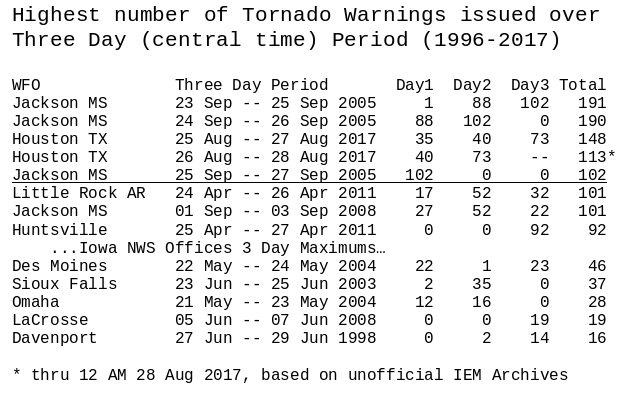
Harvey Tornado Warnings
28 Aug 2017 04:24 AM
Tropical Storm Harvey continues to absolutely pound SE Texas. While the mind blowing amounts of rain have, rightly so, garnered the vast amount of public attention, Harvey has also produced an extreme number of storms warranting tornado warnings. The NWS Houston office has been at the epicenter of this and has issued a prodigious amount of warnings over the past three days. The featured chart displays IEM computed maximum number of tornado warnings issued over a three day period. The chart also displays the maximum number for the local Iowa offices between 1996 and 2017 for comparison. Even just considering the 73 warnings issued on Sunday by Houston, this total is substantially higher than anything here in Iowa over all three days combined.
Voting: Good - 8 Bad - 1
Tags: hurricane
Tue Aug 29, 2017
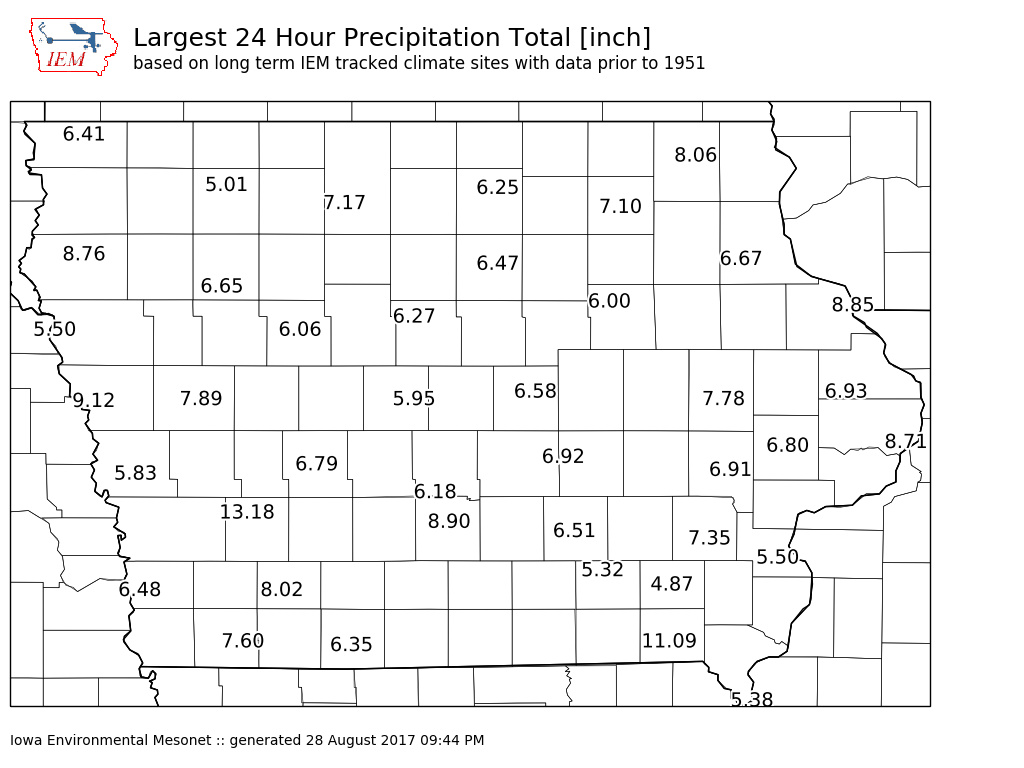
Max 24 Hour Precipitation
29 Aug 2017 05:34 AM
The hard to fathom amounts of accumulated precipitation continued overnight for SE Texas from Tropical Storm Harvey. Many locations in the Houston area have reported 24 hour totals well above 10 and even 15 inches. Putting aside that some of these same locations have reported such amounts for multiple days in a row, has Iowa ever seen anything close to those amounts? The featured map presents 24 hour max accumulations for long term climate sites that the IEM tracks. Almost all locations on the map have seen maximum amounts well below even 10 inches. The 13.18 report was from Atlantic back in June 1998. How can such a large difference exist between here and Texas? Iowa does not see slow moving tropical systems with a direct and immediate fetch of extremely moist air from the Gulf of Mexico. Our heavy rain makers tend to be progressive (they move along), don't last long enough to pile up 10+ inches of rain (sources of rich moisture are transient), and not as efficient of rain producers as tropical storm systems (cloud ice and hail reduce rainfall rates).
Voting: Good - 12 Bad - 0
Tags: climate
Wed Aug 30, 2017

Largest Monthly Totals
30 Aug 2017 05:34 AM
As with yesterday's featured map showing 24 hour precipitation maximums for Iowa, today's map shows maximum one month accumulations. Again, these totals pale in comparison with what was dumped over SE Texas from Harvey. Some reports in the area are in the 30 to 50 inch range, which are double of our wettest month in Iowa.
Voting: Good - 14 Bad - 0
Tags: climate
Thu Aug 31, 2017
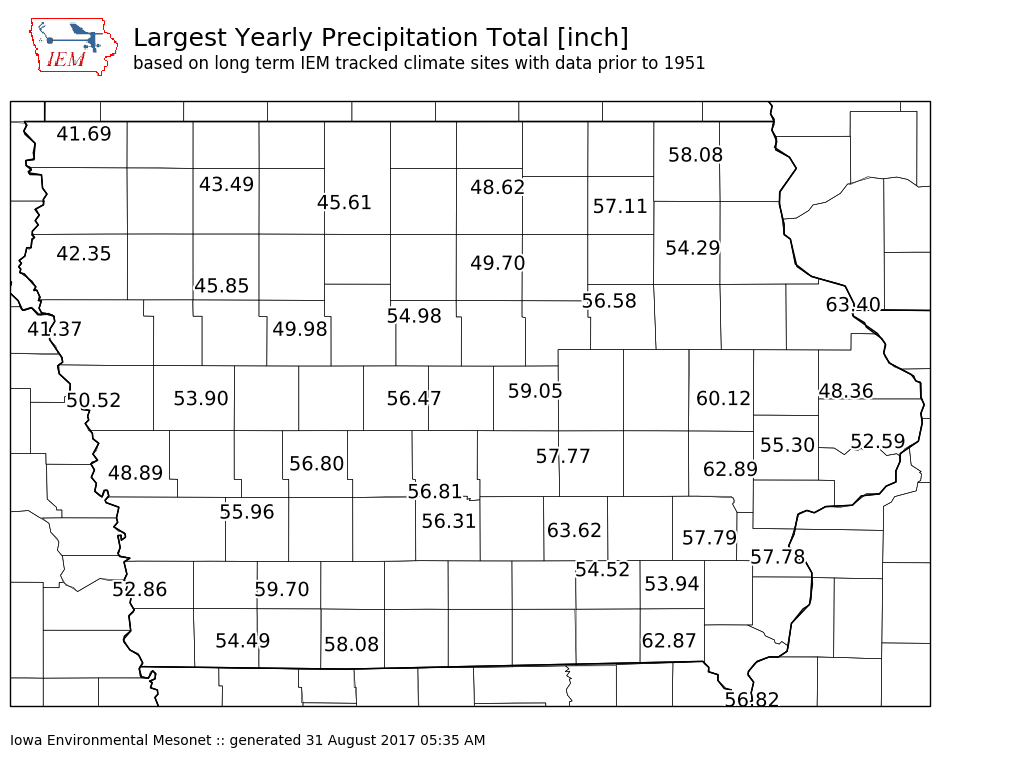
Largest Yearly Totals
31 Aug 2017 05:40 AM
To finish off the series looking at Iowa precipitation climatology, the featured map presents the largest calendar year precipitation totals for long term climate sites tracked by the IEM in the state. As with the previous maps, there are storm totals from Harvey in Texas that are larger than even the largest yearly total in Iowa. This map does show a rather large northwest to southeast gradient in the state. Tomorrow's daily feature will look into why just a large gradient exists.
Voting: Good - 10 Bad - 0
Tags: climate