IEM Daily Feature
Monday, 01 January 2018
Monday, 01 January 2018
2017 Temperature Range
Posted: 01 Jan 2018 05:59 AM
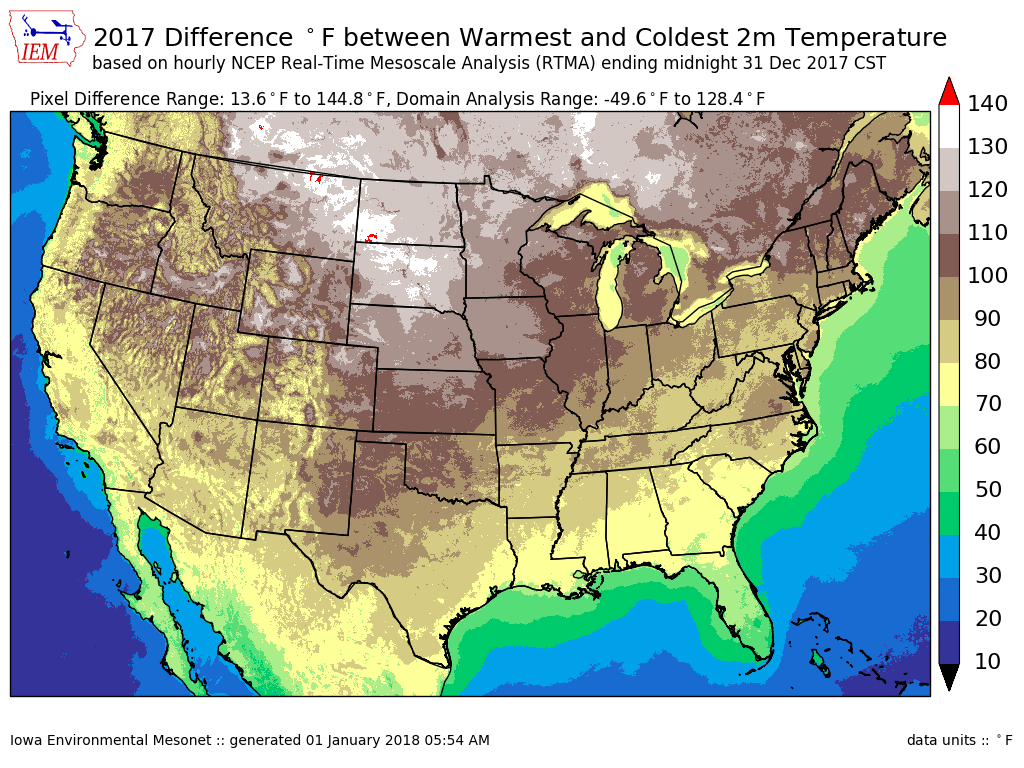
The featured map displays the difference between the warmest and coldest temperature
based on hourly high-resolution analysis produced by the Real-Time Mesoscale Analysis
(RTMA). The coldest air of the entire year arrived last evening and helped to make this
map even more extreme. Most of Iowa is shown in the 110 to 120 degree range. Even
more extreme values are found just to our north and west with a few pixels over 140
degrees! There are many interesting features on the map with the moderating effects of the
Great Lakes clearly evident and the decreased variability in temperature as you get further
away from land.
Voting:
Good = 9
Bad = 0
Tags: 2017 rtma
Voting:
Good = 9
Bad = 0
Tags: 2017 rtma