IEM Daily Feature
Wednesday, 10 August 2016
Wednesday, 10 August 2016
Comparing Arridities
Posted: 10 Aug 2016 05:29 AM
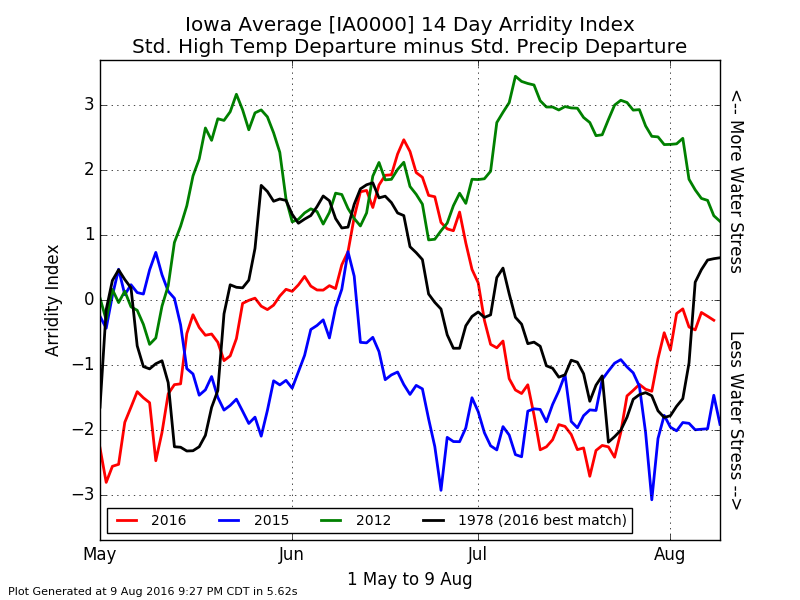
Continuing with the recent theme of featuring IEM Arridity plots, today's featured chart
compares fourteen trailing day arridities for statewide averaged temperature and
precipitation during the 1 May to 8 August period. This year is shown, along with last year
and 2012 (drought year). The plot also dynamically includes the closest match to this
year's data based on least RMSE , which is 1978. This year has seen much more stress
than last year, but pales in comparison to 2012. You can generate this plot for other
locations and periods of your choice.
Voting:
Good = 8
Bad = 1
Abstain = 1
Tags: arridity
Voting:
Good = 8
Bad = 1
Abstain = 1
Tags: arridity