IEM Daily Feature
Friday, 22 July 2016
Friday, 22 July 2016
Liquid Gold
Posted: 22 Jul 2016 05:34 AM
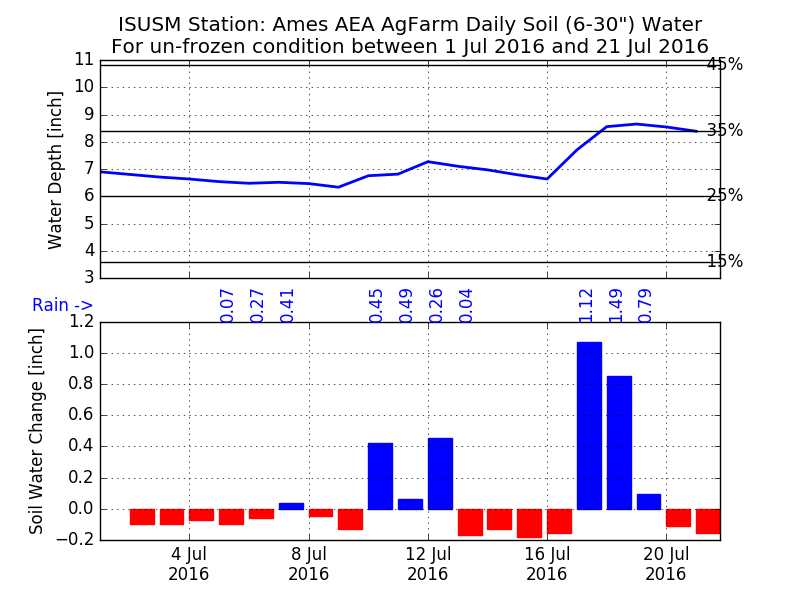
The July rains came just in time for much of central Iowa after a dry June. The featured
chart looks at the amount of soil water estimated between the 6 and 30 inch depths by the
ISU Soil Moisture station at the ISU Ag Farm west of Ames. The top panel expresses the
depth of water in this layer and the bottom shows the day to day change in depth. A few
weeks back this plot was featured to show the daily draw down that was occurring without
any replenishment. Today's featured chart shows that recharge has happened with much
of the daily rainfall (shown by the blue text) infiltrating to this layer.
Voting:
Good = 13
Bad = 0
Tags: soilmoisture
Voting:
Good = 13
Bad = 0
Tags: soilmoisture