IEM Daily Feature
Tuesday, 28 July 2015
Tuesday, 28 July 2015
Precip Effectiveness
Posted: 28 Jul 2015 05:41 AM
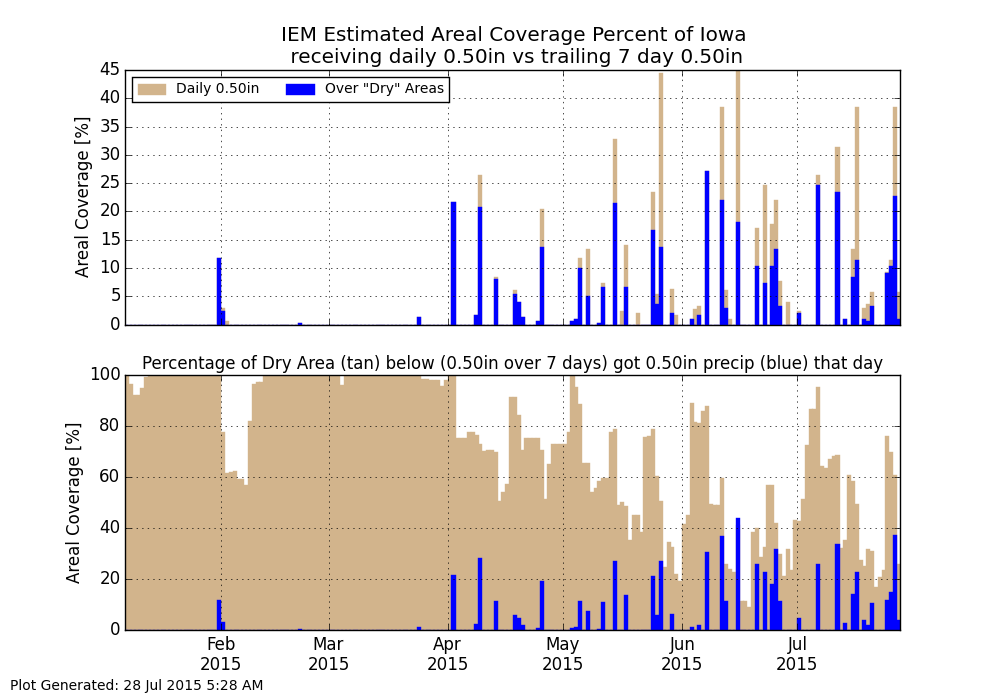
Not all precipitation events are equal. The featured chart attempts to show which precip
events are the most effective at producing rain over areas that actually need it. The top
chart displays the areal coverage of daily precipitation over 0.5 inches and the amount of
that area that was coincident with an area that had received less than 0.5 inches over the
previous seven days. The bottom chart shows the area of the state that was below 0.5
inches over the past seven days and percentage of that area that got 0.5 inches that day.
Confusing? The moral of the story is that some rain events happen over areas that are
already wet making them less effective at relieving previously dry areas. You can generate
this chart online for other years for comparison.
Voting:
Good = 16
Bad = 7
Abstain = 5
Tags: precip
Voting:
Good = 16
Bad = 7
Abstain = 5
Tags: precip