IEM Daily Feature
Wednesday, 10 June 2015
Wednesday, 10 June 2015
Period between Temps
Posted: 10 Jun 2015 05:45 AM
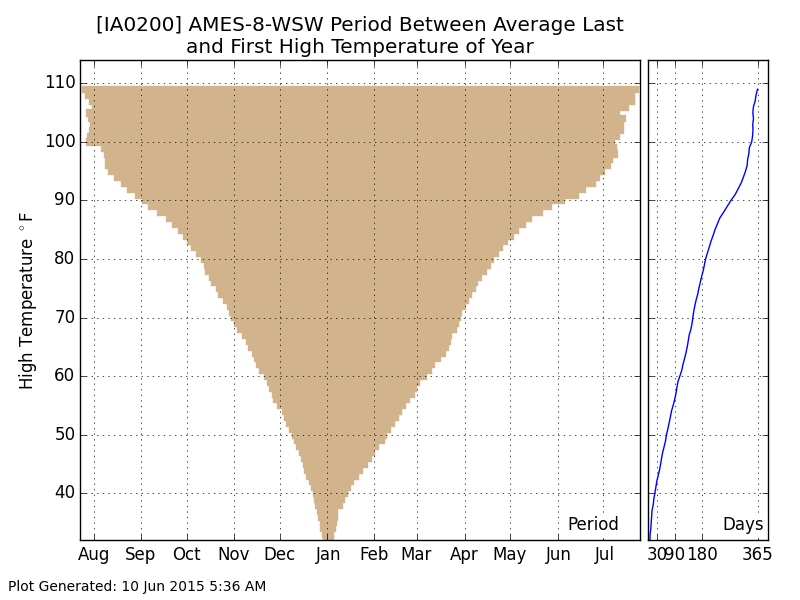
The warmest day of the year by far was yesterday with high temperatures soaring into the
90s. This was the warmest weather we have seen since last September. The featured
chart displays the period for Ames between the average last date for a high temperature at
or above a given threshold to the average first date of the year. The right hand side chart
is simply the number of days represented by the bars. The change in slope of the plot on
the right hand side is interesting and it is not clear exactly what it is illustrating, but as you
get to very warm temperatures, the annual influence on the period decreases as the
average period increases to a full year's period.
Voting:
Good = 18
Bad = 10
Abstain = 7
Tags: highs
Voting:
Good = 18
Bad = 10
Abstain = 7
Tags: highs