IEM Daily Feature
Thursday, 26 March 2015
Thursday, 26 March 2015
Getting the Frost Out
Posted: 26 Mar 2015 05:42 AM
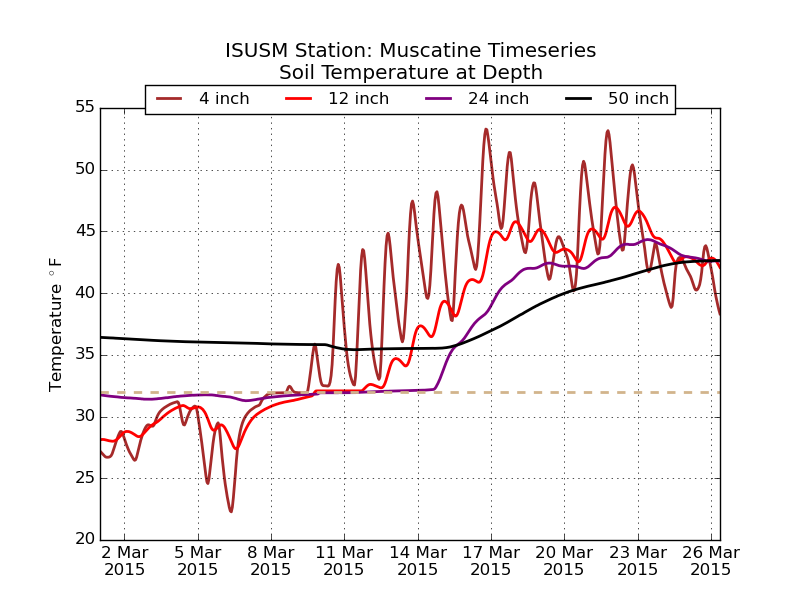
The featured chart displays time series of soil temperature observations from the
Muscatine ISU Soil Moisture site since March 1. The chart is an awesome illustration of how
the frost leaves the ground. Prior to March 7th, the four, twelve, and 24 inch readings were
all below freezing. The frost had not made it to the 50 inch depth. As the soil layers
warmed and reached freezing, it took a bit of time to punch through the freezing point level.
This is due to processes that take extra amounts of heat to convert the frozen water in the
soil to liquid. The four inch punched through first and then twelve and then 24. The chart
shows that this process took eight days to reach 24 inches. Eventually the warming
reached 50 inches and its temperature slowly started to rise as well.
Voting:
Good = 18
Bad = 12
Abstain = 8
Tags: soiltemp
Voting:
Good = 18
Bad = 12
Abstain = 8
Tags: soiltemp