IEM Daily Feature
Wednesday, 03 December 2014
Wednesday, 03 December 2014
24 Hour Changes
Posted: 03 Dec 2014 05:44 AM
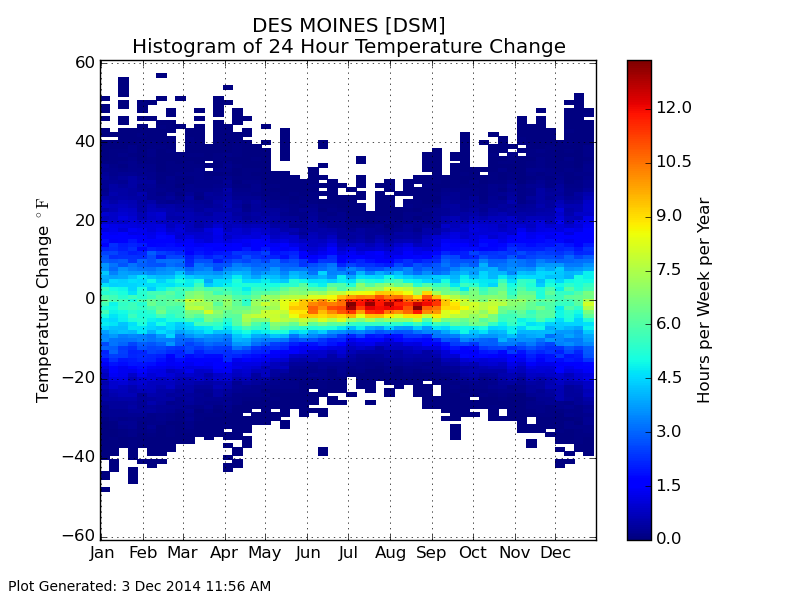
Yesterday's feature presented the largest temperature drop over 24 hours for the most
recent cold front passage. Today's featured chart presents a histogram of these changes
for Des Moines over its period of record by week of the year. The area of peak
frequencies is interesting in this plot. It exists for slightly negative numbers between June
and October. This area represents slight day to day cooling with temperatures being the
most common regime. Without solar input, our temperatures would cool each day, that is
our baseline regime. Warm air masses and the sun fight this cooling each day, attempting
to warm us up.
Voting:
Good = 14
Bad = 10
Abstain = 4
Tags: temperatures
Voting:
Good = 14
Bad = 10
Abstain = 4
Tags: temperatures