IEM Daily Feature
Wednesday, 03 September 2014
Wednesday, 03 September 2014
Precip Bins
Posted: 03 Sep 2014 05:44 AM
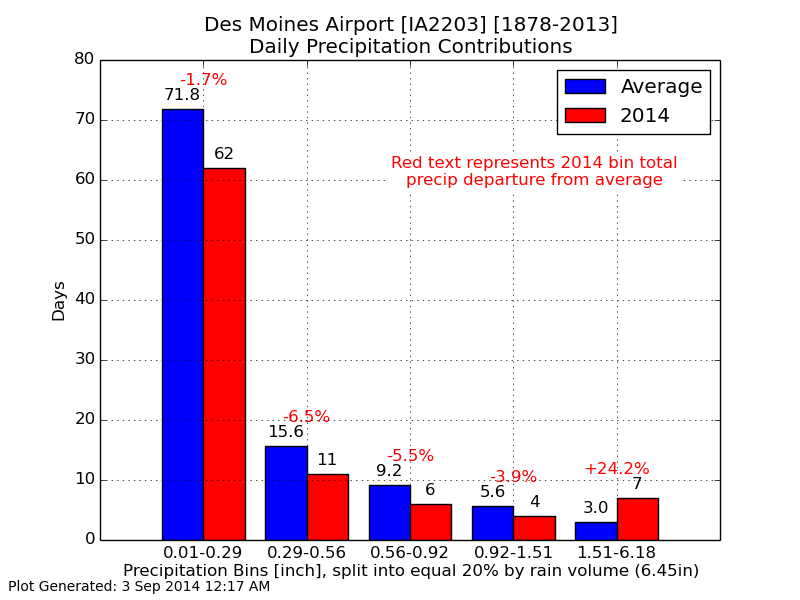
The featured chart looks at the contribution to yearly precipitation total and number of rainy
days that individual daily precipitation values have. For this analysis, the daily
precipitation is binned into five ranges that over the long term history each contribute 20%
to the yearly total precipitation. The bars represent the number of days per year with a
daily precipitation within that range. For Des Moines, approximately 72 days per year
receive between 0.01 and 0.29 inches of precipitation. The red bars represent what has
happened so far this year, with the red labelled percentages indicating the departure the
total rainfall for that bin has had this year. A lot is going on! For this year, the largest
intensity bin has seen seven days versus just an average of three days and these seven
days have exceeded the bin total accumulation by 24%. Of course, the 2014 values are
still accumulating and the blue bars represent the full year average.
Voting:
Good = 11
Bad = 6
Abstain = 3
Tags: precip
Voting:
Good = 11
Bad = 6
Abstain = 3
Tags: precip