IEM Daily Feature
Tuesday, 31 July 2012
Tuesday, 31 July 2012
Arbitrary Metrics
Posted: 31 Jul 2012 05:43 AM
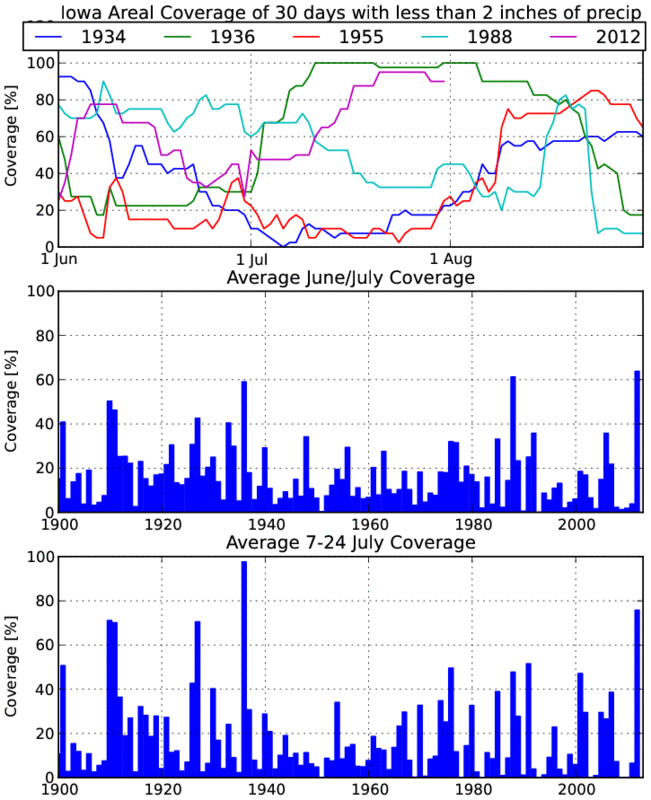
This feature continues the series of comparing how the drought this
growing season stacks up with previous years. For this metric, an
estimated areal coverage of Iowa is presented that had a previous
thirty day period with less than two inches of total rainfall received.
This arbitrary metric attempts to show the breadth of dry continues and
how it changed over the period. The top chart presents the daily
coverage for this year and four previous years of note. In this
comparison, 2012 shows up much worse than 1988 in late July, but better
in late June. The middle chart presents the simple average of the
value over the June and July period and 2012 has the highest value
around 60% since the year 1900 followed closely by 1988. The bottom
chart looks at this value during a key period for corn development in
mid-July. 1936 is easily the largest average coverage as shown by this
metric. So the question remains unresolved, how does this year compare
with previous drought years? Is it worse than 1988?
Voting:
Good = 53
Bad = 14
Tags: 2012 1955 1934 1936 1988
Voting:
Good = 53
Bad = 14
Tags: 2012 1955 1934 1936 1988