IEM Daily Feature
Wednesday, 08 February 2012
Wednesday, 08 February 2012
Minimal Winter
Posted: 08 Feb 2012 05:54 AM
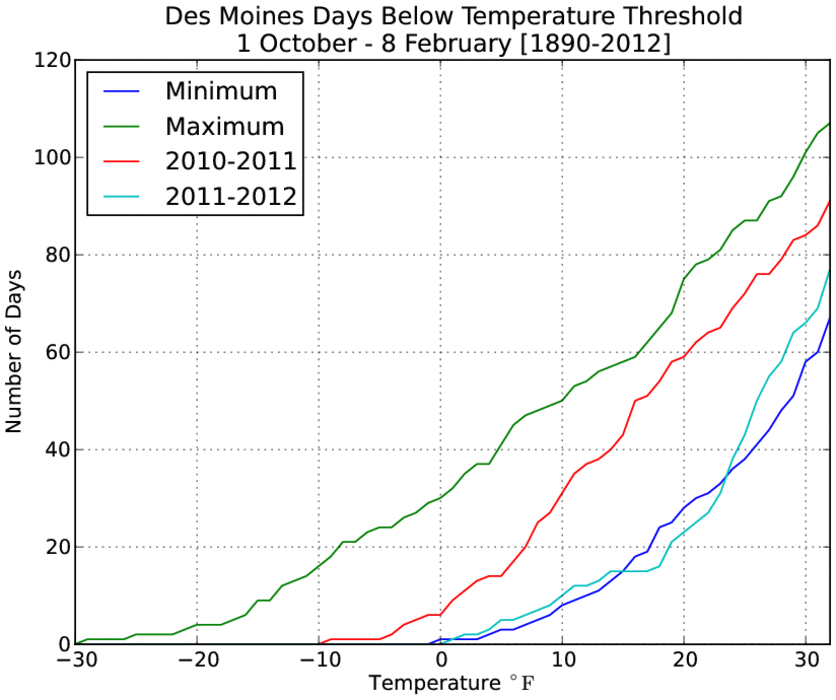
The featured chart is another illustration of how warm this winter has
been. The chart shows the number of days this winter season that the
low temperature has been at or below a given temperature threshold.
The blue line represents the minimum total for any year prior to this
year. The teal line is this winter and it closely hugs or exceeds the
previous minimum at some thresholds. The overall minimum temperature
has only been 1 degree this year, which would be the warmest on record
if it stands for the rest of winter. Our last winter is plotted in red
and shows how much different it was than this year.
Voting:
Good = 14
Bad = 3
Tags: 2012
Voting:
Good = 14
Bad = 3
Tags: 2012