IEM Daily Feature
Monday, 18 October 2010
Monday, 18 October 2010
Monthly patterns
Posted: 18 Oct 2010 05:47 AM
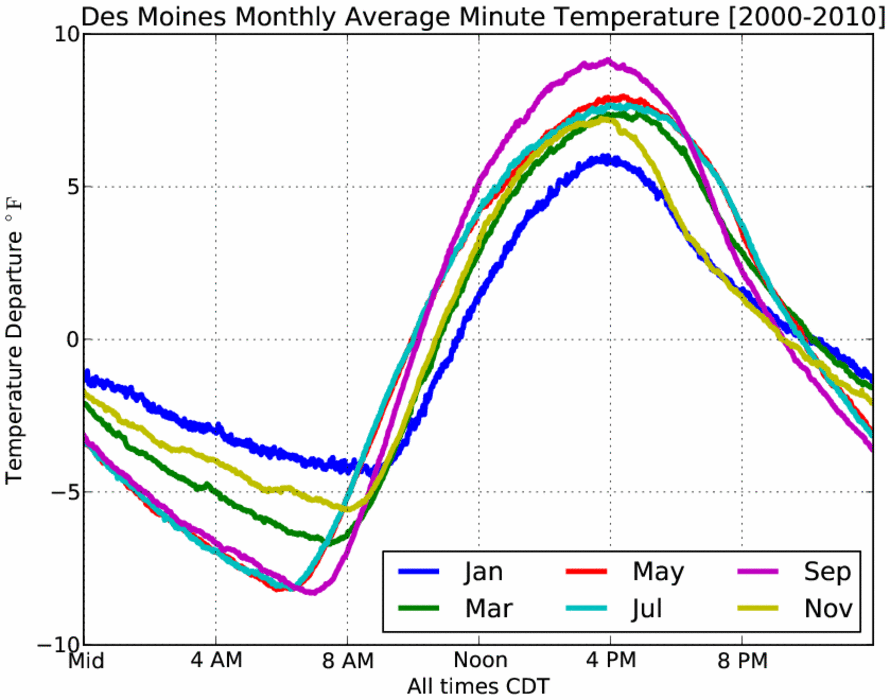
Continuing along looking at the diurnal cycle of temperatures, the
featured graph presents the monthly average for six months out of the
year. The weakest signal is shown in January and the strongest in
September. It is interesting to contrast the patterns as September
has the most rapid warming, but also the most rapid cooling. This is
a result of still having significant sunshine, but also dry air
allowing the rapid changes. It is curious to note how similiar July
and May are. This analysis is based on minute interval data dating
back to only 2000.
Voting:
Good = 22
Bad = 1
Tags: climate temp
Voting:
Good = 22
Bad = 1
Tags: climate temp